Expected Points Model for Rugby Betting: Building a Predictive Framework
 Available in US

Every Rugby Score Starts as a Probability Before It Becomes a Number
I built my first expected points model in a spreadsheet five years ago. It was crude — team averages, home advantage adjustment, and a manual correction for strength of schedule. The model predicted that a Premiership side would score 24 points in a fixture where the bookmaker’s line implied 21. I bet the over. The final score was 27-19. The model was right, the bookmaker was wrong, and I had a framework I could refine rather than an opinion I could not measure.
An expected points model estimates how many points each side is likely to score in a given match, based on historical performance data adjusted for context. It does not predict exact scores — no model can do that reliably in rugby, where a single try changes the total by 5-7 points. Instead, it generates probability distributions: the range of likely outcomes and the probability of each. That distribution is the raw material for every bet I place, because it lets me compare my assessment to the bookmaker’s implied probabilities and identify discrepancies.
Core Inputs for a Rugby Expected Points Model
What goes into the model matters more than how sophisticated the maths is. I have seen bettors build elaborate statistical models on poor inputs and wonder why they underperform simpler approaches built on better data. The core inputs for a rugby expected points model are: scoring averages, defensive averages, venue adjustment, opponent strength and recent form weighting.
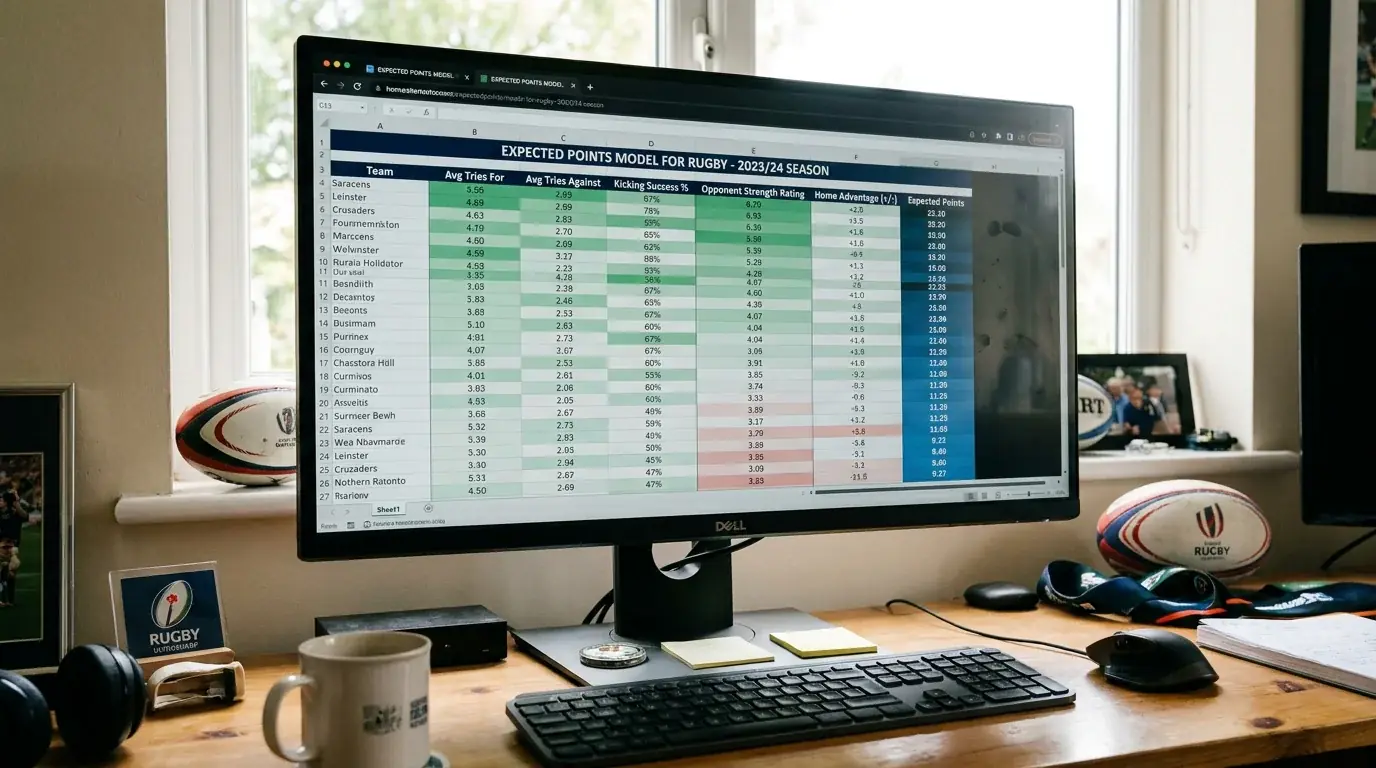
Scoring averages capture how many points a side typically scores per match. I use a weighted average that gives more importance to recent matches — the last six for club rugby, the last four for internationals — because current form is a better predictor than season-long averages. A side that averaged 25 points per match across the season but has scored 32, 28 and 35 in its last three is performing above its seasonal baseline, and the model should reflect that upward trend.
Defensive averages work identically in reverse: how many points does the side concede? The defensive average is the more stable of the two metrics, because defensive performance in rugby is more consistent than attacking output. A side’s defensive system changes less from match to match than its attacking execution, which depends on individual moments of skill, luck and referee interpretation. The global sports betting market stands at $125.12 billion in 2026, and the models that power professional trading desks weight defensive data more heavily than offensive data for exactly this reason.
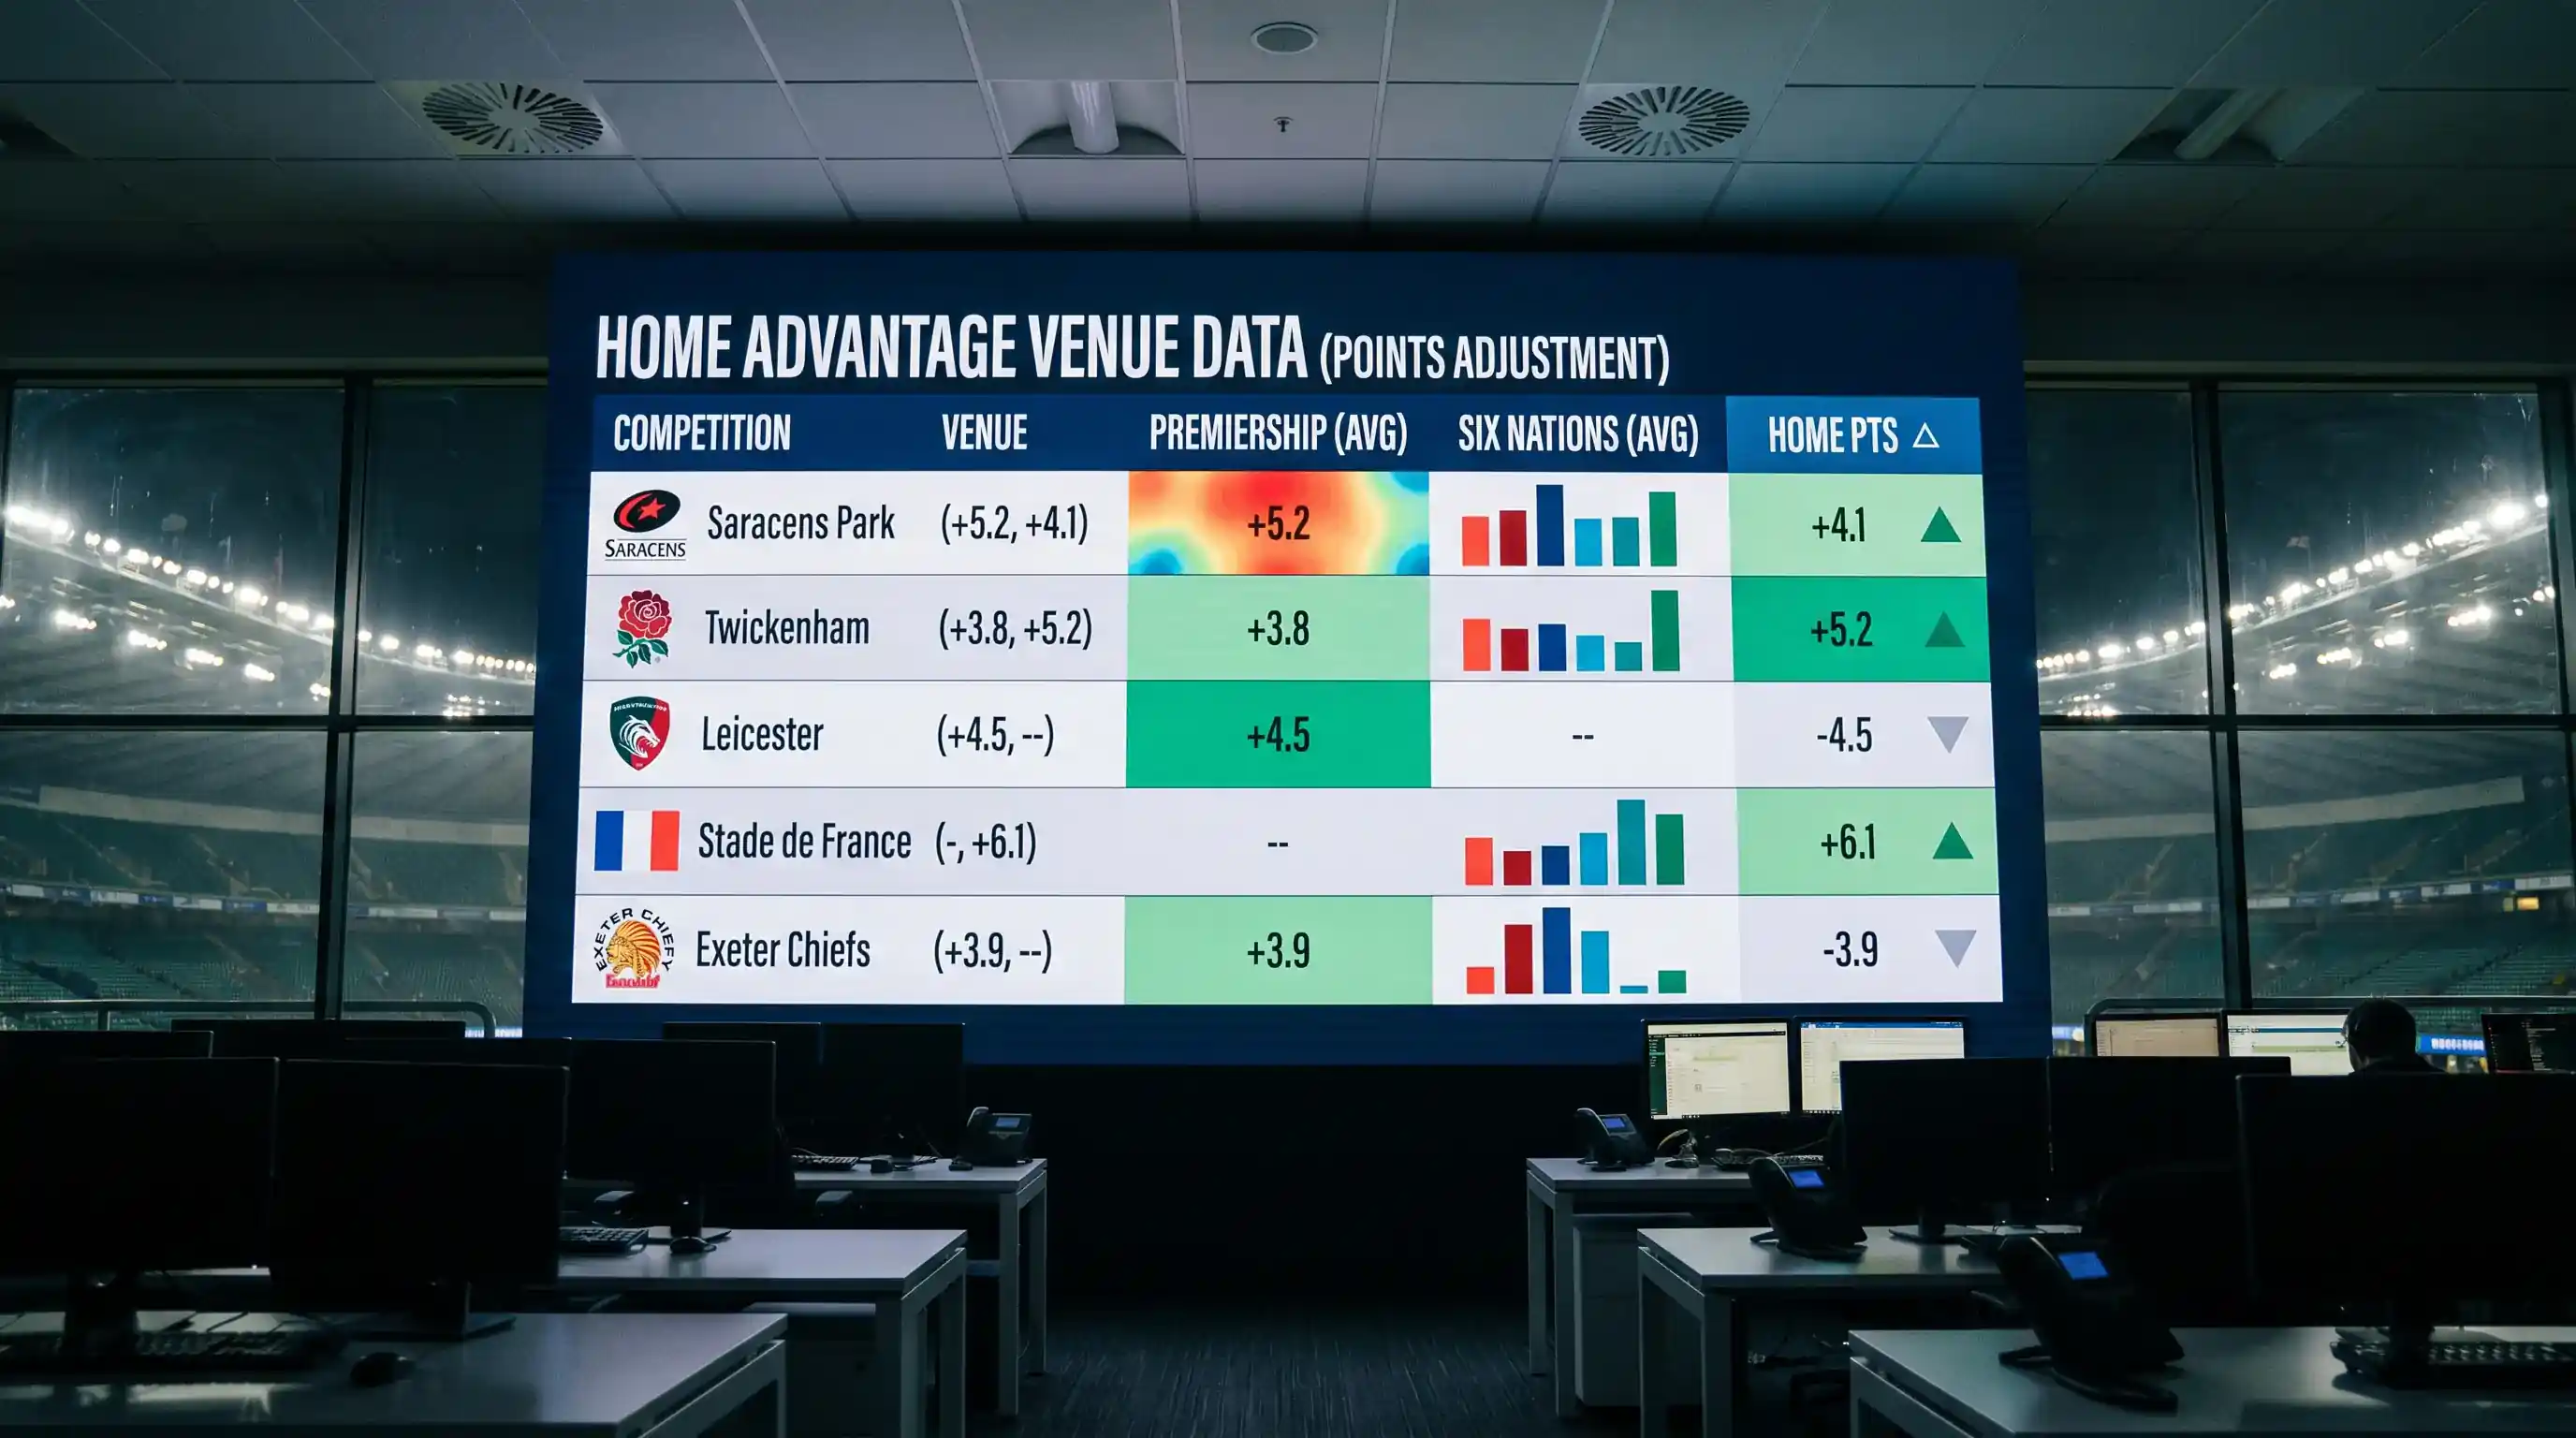
Venue adjustment adds points to the home side’s expected score and subtracts from the away side’s. In the Premiership, home advantage is worth approximately 3-5 points on the total, split roughly 60/40 between the home side scoring more and the away side scoring less. I use a fixed adjustment of 4 points for Premiership matches and vary it by competition: Six Nations home advantage is stronger (closer to 6 points) because the crowd effect is amplified in international fixtures.
Opponent strength normalises the raw averages. If a side has scored 30 points per match over its last six, but four of those matches were against bottom-half opposition, the raw average overstates their attacking quality against a top-half opponent. I adjust using relative defensive strength: a side facing the league’s best defence should expect to score fewer points than its average, and vice versa.
From Expected Points to Betting Decisions
A reader once asked me how an expected score of 23-18 translates into actual bets. The answer is that the point estimate alone is insufficient — you need the distribution around it. If my model says 23-18 with a standard deviation of 8 points per side, the range of likely outcomes is wide enough that the over/under line, the handicap and the match-winner odds all become evaluable.

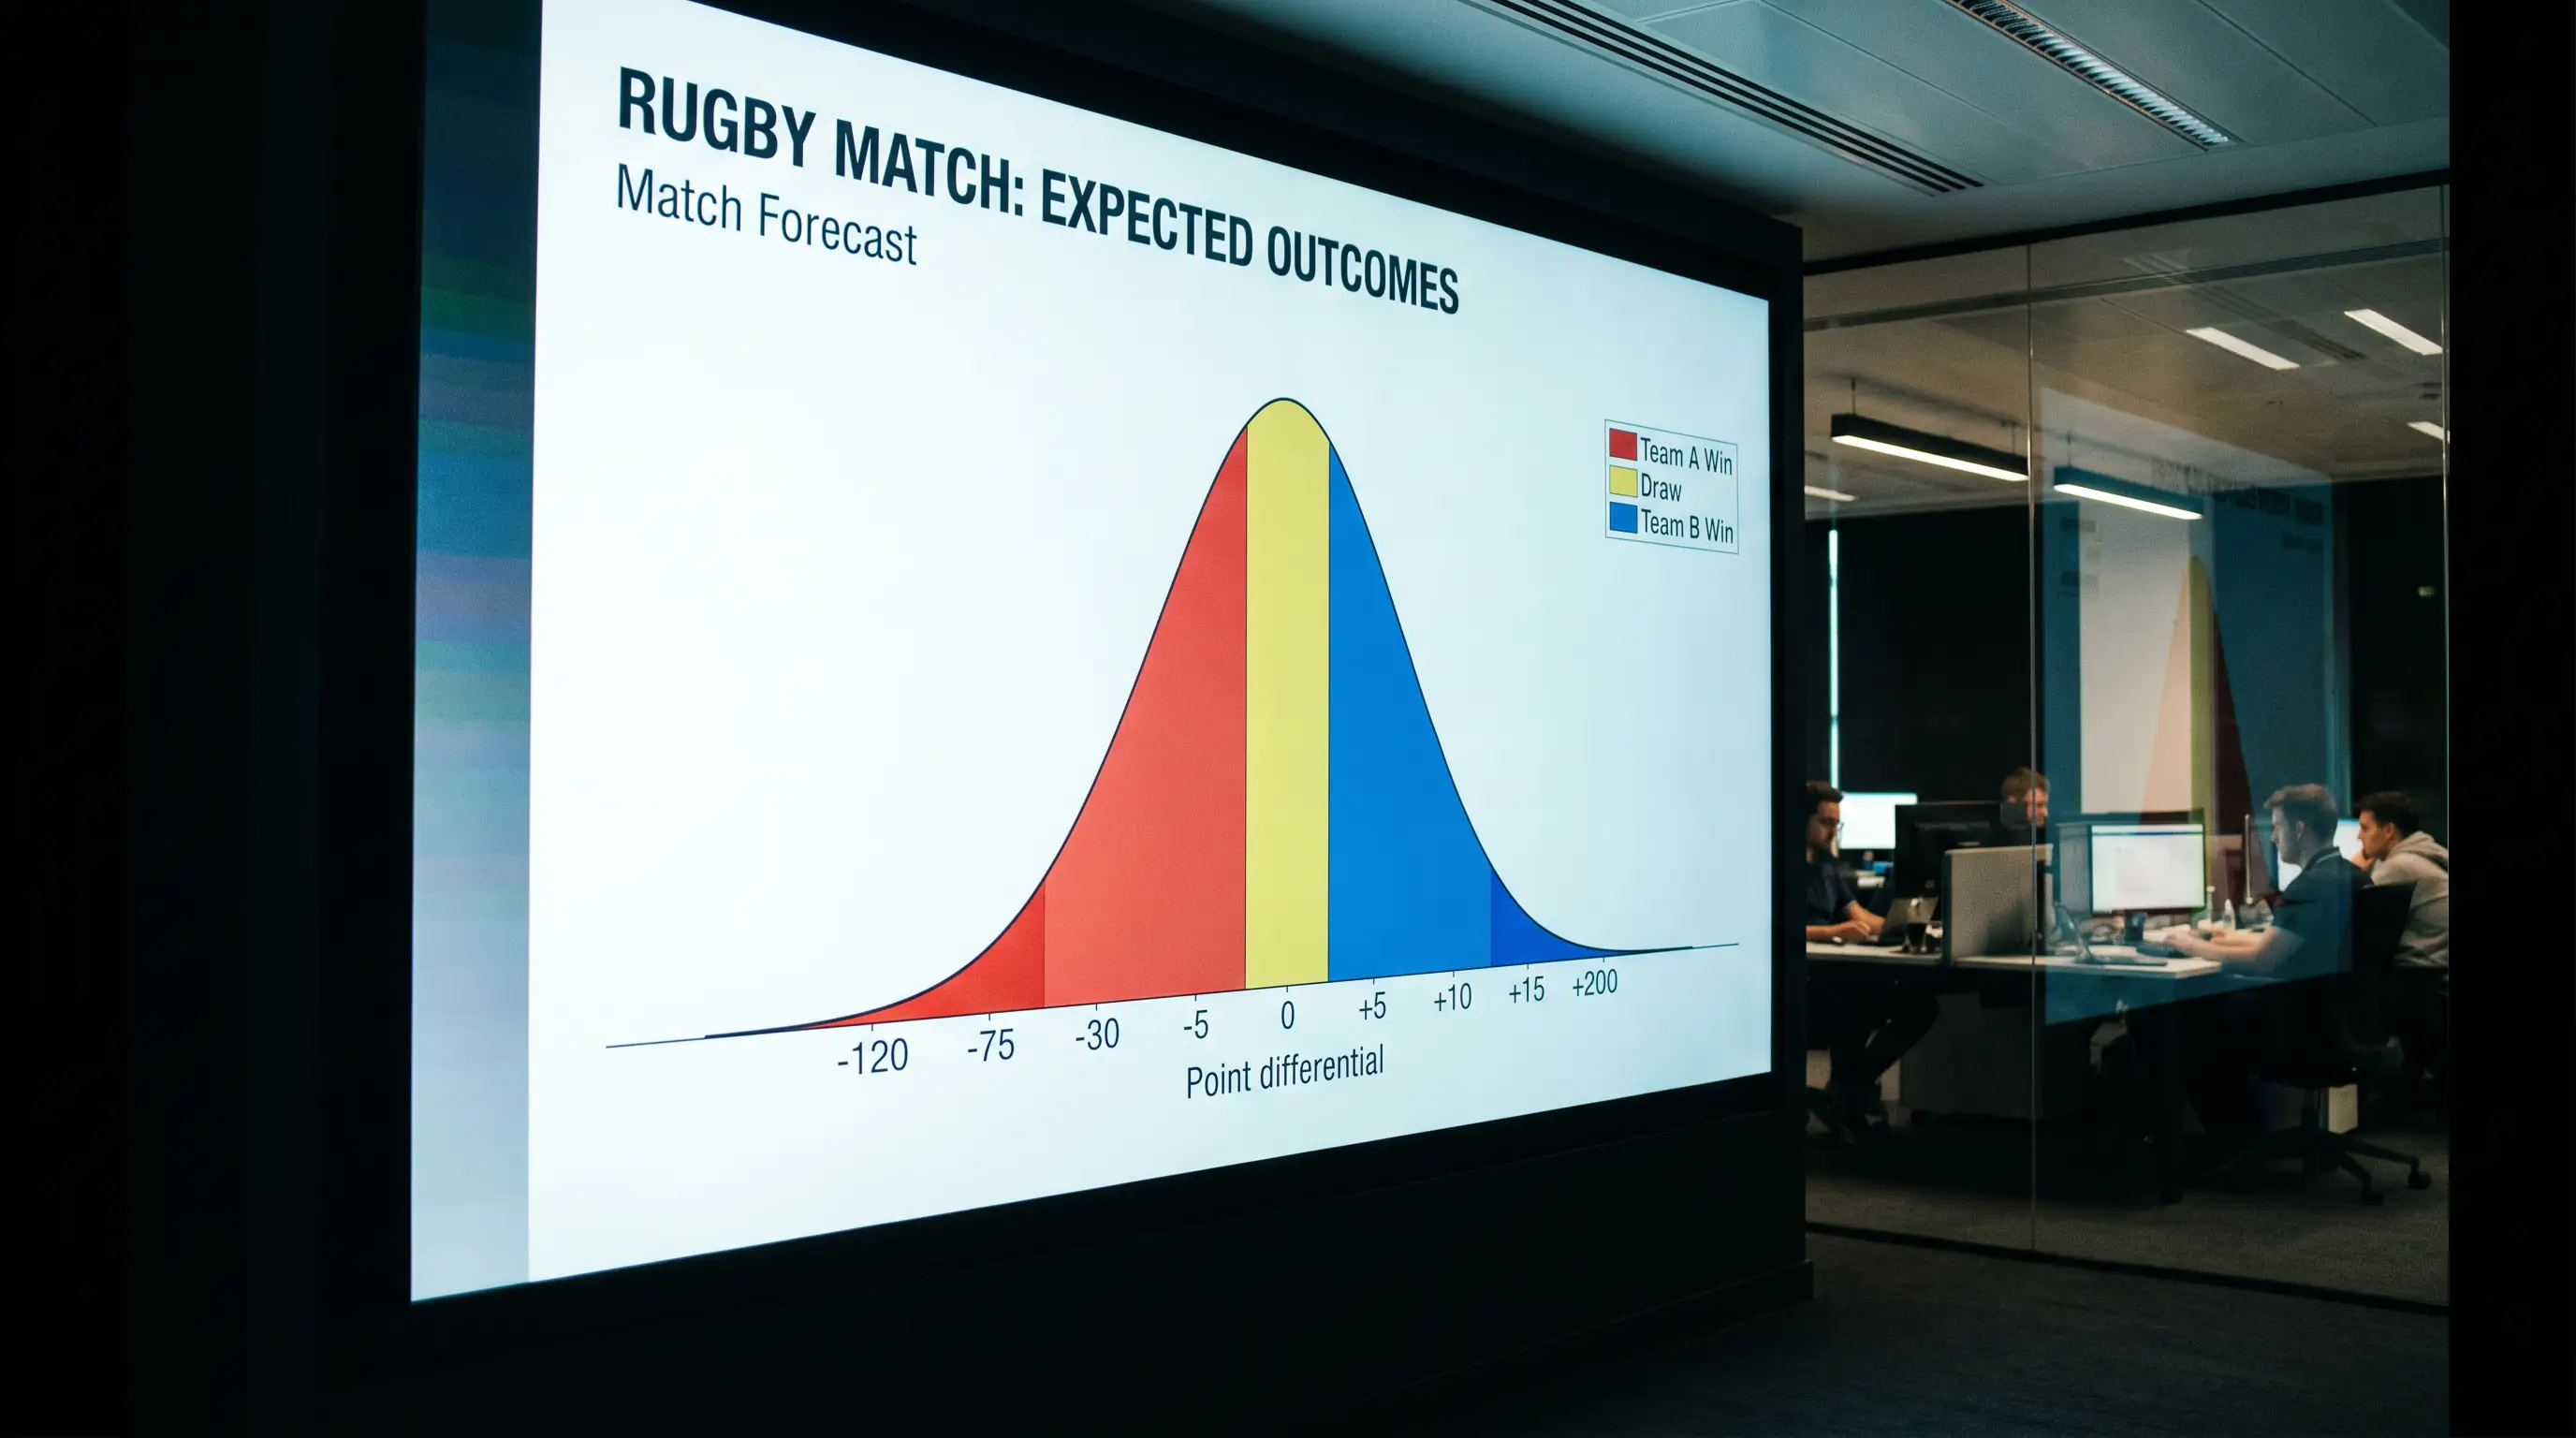
Take the totals market first. My model expects a combined total of 41. The bookmaker has set the over/under line at 44.5. My model says the probability of the total exceeding 44.5 is approximately 38%, which means the under is the value side. If the bookmaker’s odds on the under imply a probability of 48% (decimal odds around 2.10), I have found a 10-percentage-point gap between my assessment and the market. That gap is large enough to bet.
The handicap market follows the same logic. My expected margin is 5 points in favour of the home side. The bookmaker has set the handicap at -7.5 for the home side. My model says the probability of the home side winning by 8 or more is roughly 40%. If the odds on -7.5 are 1.90 (implying 52.6% probability), the handicap line is wrong in my model’s assessment, and I would back the away side on +7.5.
Match-winner markets are the least interesting for model-driven bettors because they are the most efficiently priced. The volume of money on match-winner markets is enormous, which forces the odds to converge on accurate probabilities quickly. My model rarely finds significant value in match-winner markets for high-profile fixtures, though it does find occasional edges on lower-profile domestic matches where the volume is thinner. Sportradar monitors over 1,000,000 sporting events globally, and their data confirms that lower-profile markets carry wider pricing margins — which means more opportunity for model-driven bettors.
Calibrating and Improving Your Model Over Time
The model I use today is not the model I built five years ago. It has been calibrated, adjusted and partially rebuilt multiple times, and that iterative process is what separates a profitable model from a spreadsheet exercise.
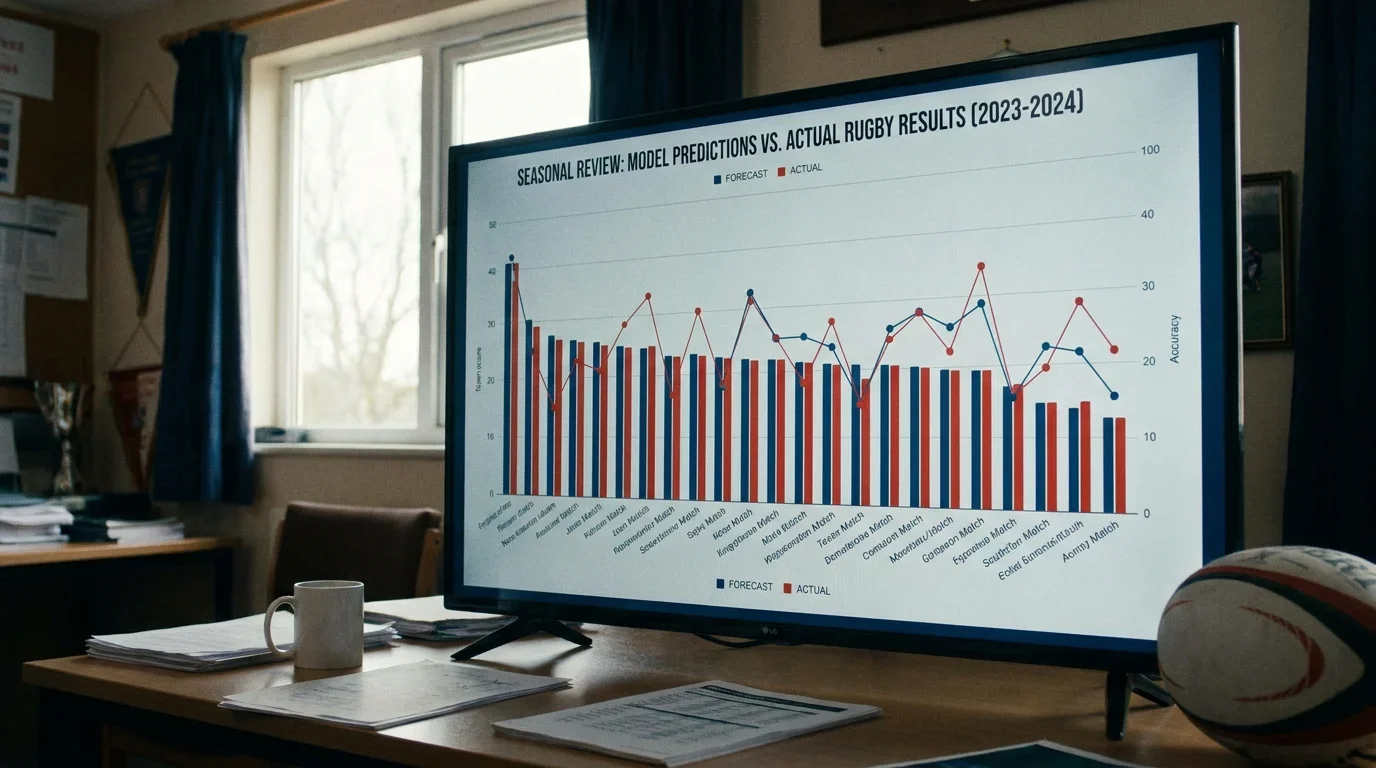
Calibration means comparing your model’s predictions to actual outcomes over a large sample. At the end of each season, I run every prediction through a calibration check: if my model said a side had a 60% chance of winning, did they win approximately 60% of the time across all such predictions? If the model systematically overestimates or underestimates probabilities in certain ranges, I adjust the parameters. A well-calibrated model is not one that gets every prediction right — it is one whose probabilities match reality over hundreds of predictions.
The most common calibration error I have encountered in my own model is overweighting recent form. Early versions of my model gave too much importance to the last three matches, which made it reactive to short-term noise. I found that a six-match window with a linear decay weighting — the most recent match counts most, each prior match counts progressively less — produced better calibration than either a flat average or a heavily front-loaded weighting.
I share this openly because the model itself is not the competitive advantage. The advantage lies in disciplined application: running the model before every fixture, comparing outputs to the market, placing bets only when the gap exceeds a threshold I have set in advance, and reviewing the results monthly rather than reacting to individual outcomes. For a broader perspective on how statistical frameworks apply across rugby markets, rugby form guide for betting expands on the tools and techniques that underpin this approach.
Do I need programming skills to build a rugby expected points model?
No. A basic model can be built in a standard spreadsheet using weighted averages, venue adjustments and opponent-strength corrections. Programming helps if you want to automate data collection or run simulations, but the analytical framework is more important than the technical implementation. Start simple, test against actual results, and add complexity only when the calibration data tells you where the model is falling short.
How accurate are expected points models for rugby?
No model predicts exact scores reliably. Rugby has high variance — a single try changes the total by 5-7 points. The value of an expected points model lies in generating accurate probability distributions rather than precise point predictions. A well-calibrated model that assigns a 55% probability to an outcome that actually occurs 55% of the time is performing excellently, even though it is wrong 45% of the time on any individual bet.
Created by the ”Rugby Betting Tips” editorial team.