Half-Time Full-Time Rugby Betting: Reading the Shape of a Match Before It Happens
 Available in US
Why Predicting the Shape of a Match Pays More Than Picking the Winner
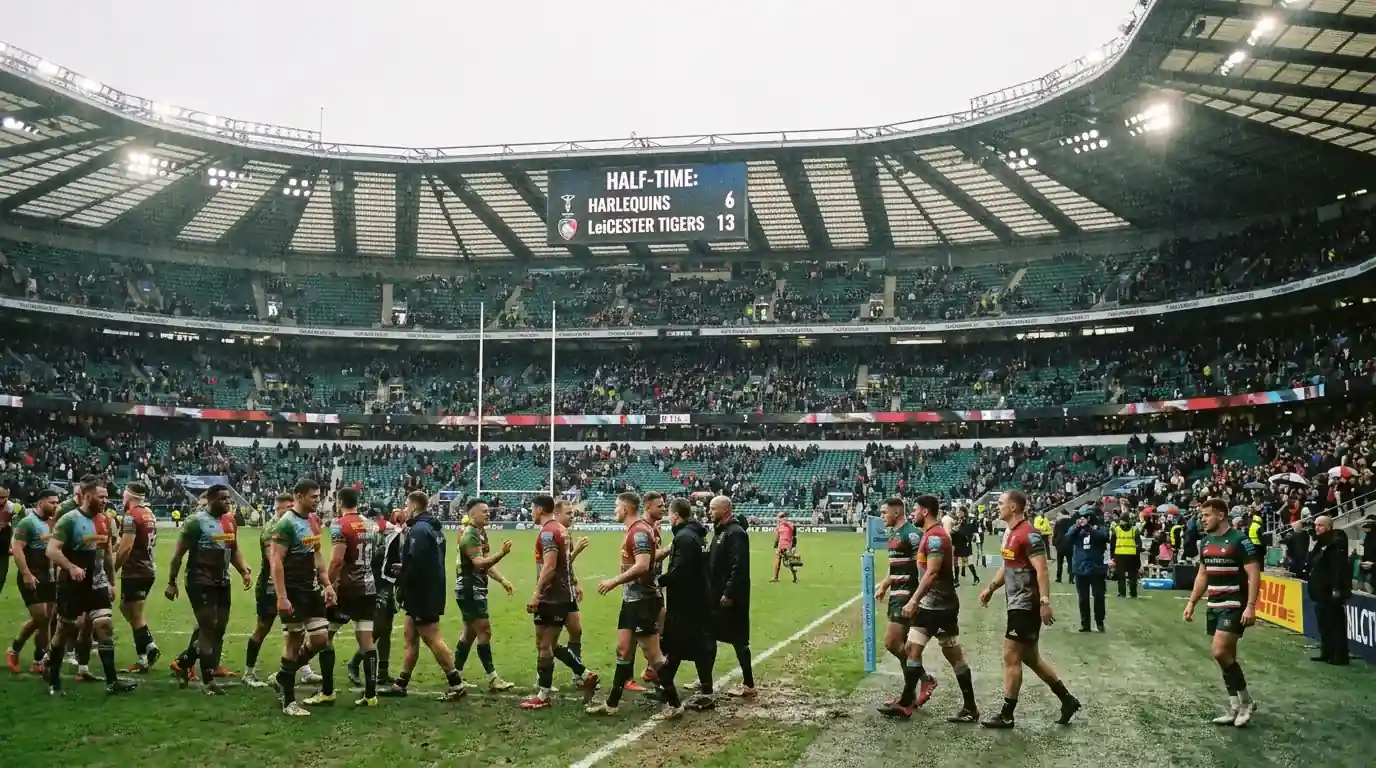
March 2024. France versus Ireland in the Six Nations. I had France to lead at half-time and win at full-time at 3.40. France led 17-6 at the break and won 31-24. The match-winner odds on France had been 1.85 — a perfectly fine bet, but the HT/FT market paid nearly double for the same outcome because I added one layer of specificity: the shape of the victory. That is the core appeal of half-time/full-time betting. You are not just predicting who wins — you are predicting how the match unfolds across its two halves.
The HT/FT market offers nine possible outcomes: home leads at half-time and wins, home leads at half-time and draws, home leads at half-time and loses, and so on through every combination of draw and away lead across both periods. Each combination carries its own odds, and the less intuitive outcomes — a side trailing at the break but winning at full-time, for example — pay significantly more because they are rarer.
The Six Nations 2025 averaged 55 points per match, but the distribution across halves was far from even. Understanding how scoring patterns shift between the first and second half is the key to extracting value from this market, because bookmakers price HT/FT combinations based on overall match probabilities rather than granular half-by-half analysis.
How Scoring Splits Between Halves in Rugby
I started tracking half-by-half scoring data three seasons ago, and the pattern is remarkably consistent. In most professional rugby competitions, the second half produces more points than the first. The reasons are structural: substitutions inject fresh legs into tiring packs, defensive discipline deteriorates as fatigue accumulates, and teams trailing at half-time take greater tactical risks to chase the result.

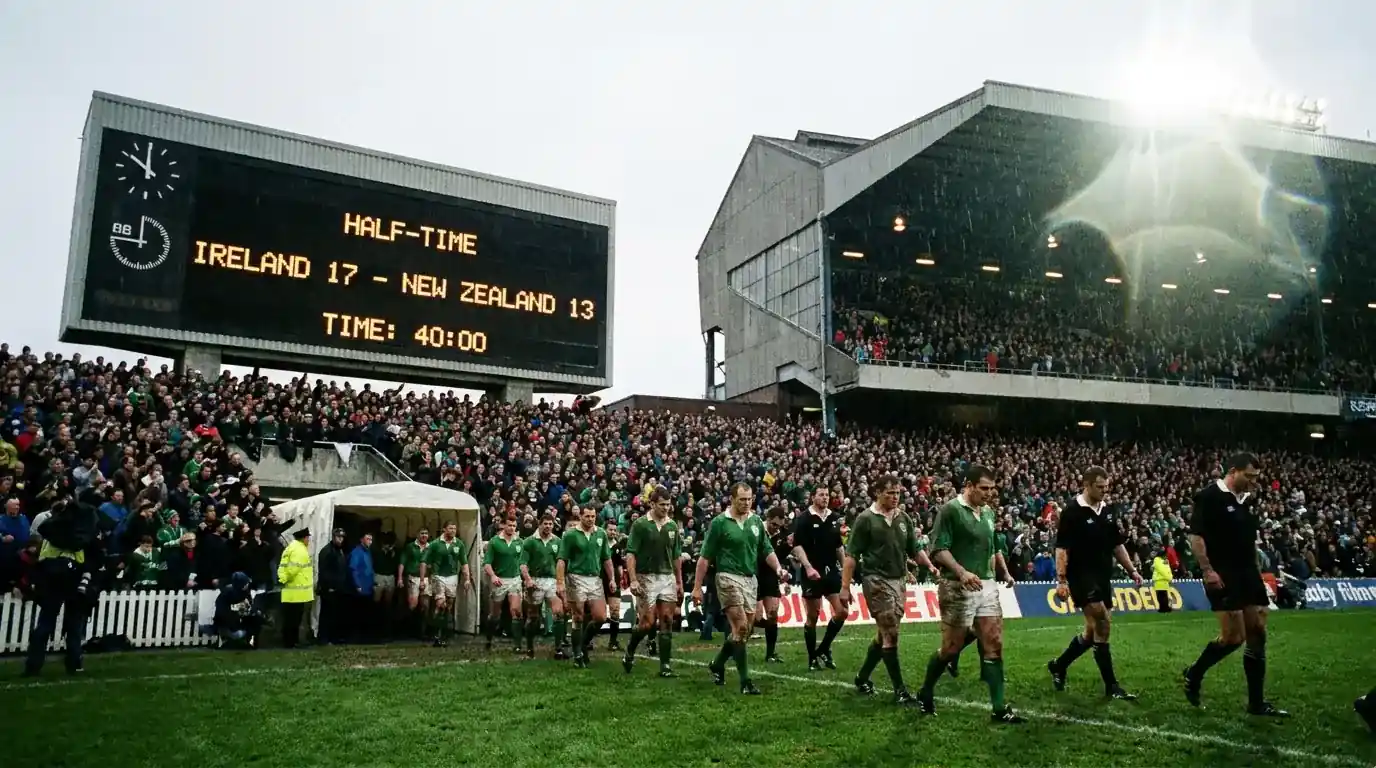
In the Premiership, second halves produce approximately 10-15% more points than first halves across a full season. That asymmetry is meaningful for HT/FT betting because it affects the probability of comebacks. A side trailing by 7 points at the break has a higher probability of overturning that deficit than the first-half scoreline alone suggests, because the second-half environment structurally favours increased scoring.
International rugby shows the same pattern, amplified by the intensity of test match first halves. Teams play conservatively in the opening forty minutes — kicking for territory, testing the opposition’s set-piece, avoiding risky attacking plays in their own half. The second half opens up as coaches commit to their attacking game plans and bench players arrive with fresh energy. France scored 218 points across the 2025 Six Nations, and their scoring rate in second halves was noticeably higher than in first halves across all five fixtures.
Nine Outcomes and Where the Value Hides
When I first looked at HT/FT markets in rugby, I assumed the value would sit in the exotic outcomes — a side trailing at the break but winning at full-time. Those comeback scenarios do pay handsomely, typically between 8.00 and 15.00, but their true probability is low enough that the margin on those prices is enormous. The bookmaker knows that casual bettors are attracted to long odds on dramatic turnarounds, and prices accordingly.
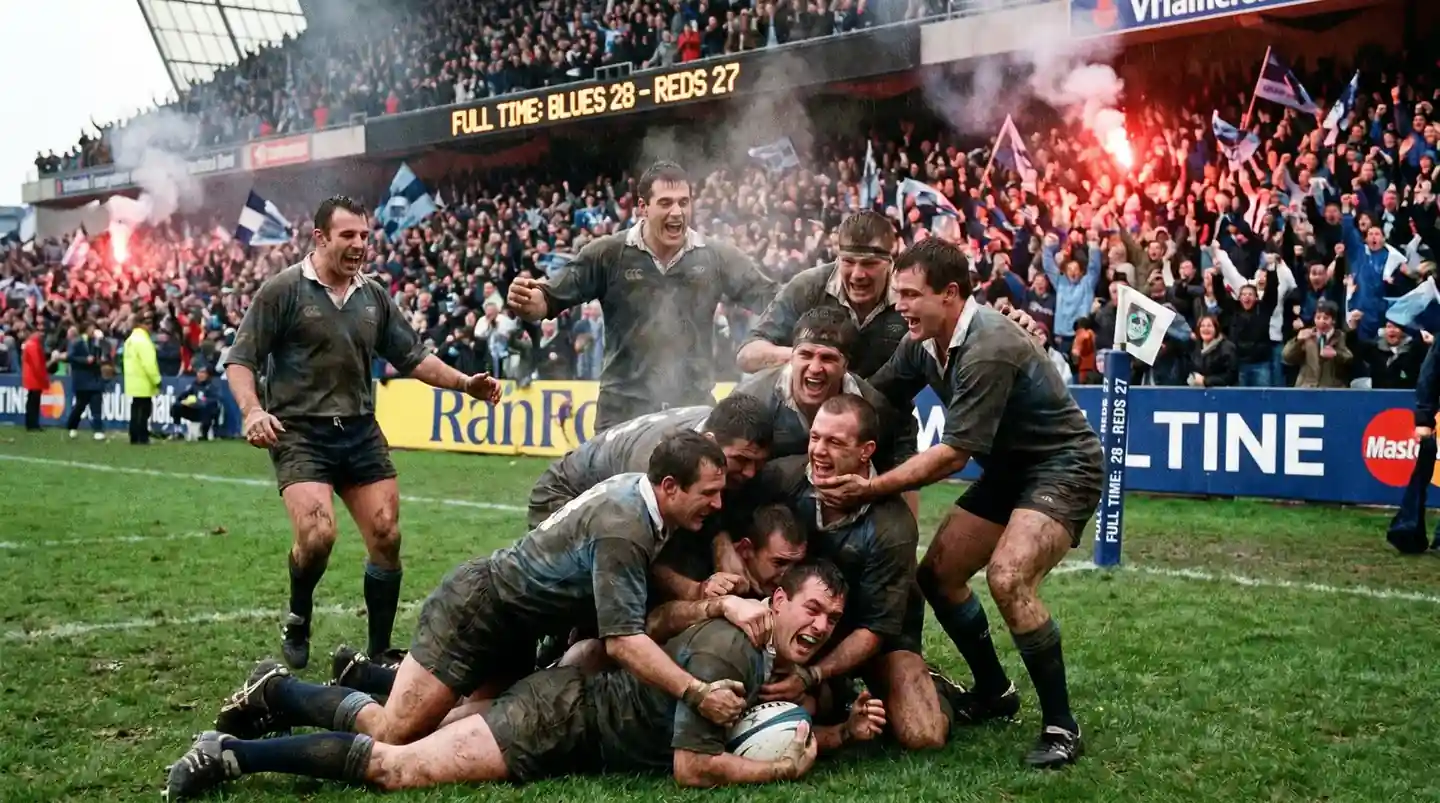
The value I have found most consistently sits in less glamorous outcomes. Home/Home — the home side leading at both half-time and full-time — is often underpriced in matches where the home side is a clear favourite but not overwhelmingly so. The bookmaker sets the match-winner odds for the home side at, say, 1.50, and the HT/FT Home/Home at 2.20. If my model says the home side has an 80% chance of winning and a 55% chance of leading at both intervals, the HT/FT bet offers better expected value than the match-winner.
Draw/Home and Draw/Away are the most overlooked outcomes. A drawn first half is more common in rugby than casual bettors assume, particularly in tight fixtures between evenly matched sides where the opening forty minutes are dominated by penalties and territory. If neither side has scored a try by half-time and the score is 6-6 or 9-9 on penalties, the Draw/Home or Draw/Away combinations can carry genuine value because the bookmaker’s model often underestimates the probability of a level first half.
The outcome I almost never bet is Away/Home — the visiting side leading at half-time but losing at full-time. While it does happen, the conditions required for it are specific: a strong home side starting slowly, an away side over-performing early, and a decisive second-half correction. Those conditions are hard to predict systematically, and the odds on offer rarely compensate for the difficulty.
Building a Half-by-Half Model for Rugby
Do you need a spreadsheet model to bet HT/FT markets? No. But you need a framework that goes beyond gut instinct. Mine is built on three inputs: first-half scoring tendencies, second-half scoring tendencies, and the expected match-winner margin.

First-half scoring tendencies tell you how each side typically performs in the opening period. Some teams are fast starters — they score early, build leads, and then manage the second half. Others are slow burners who concede early and rely on second-half surges. This is not speculation; it is visible in the data. Track each side’s first-half points-for and points-against over the last ten matches, and you will see clear patterns emerge. A side that has been outscored in the first half in seven of their last ten but still won five of those matches is a classic Draw/Home or Away/Home profile.
Second-half scoring tendencies incorporate the substitution effect. A side with a dominant bench — physically imposing finishers who replace tiring starters around the 50-minute mark — will systematically outscore opponents in the final quarter. That bench strength does not show up in the match-winner odds, but it strongly influences the HT/FT distribution. UK bookmakers process around 290 million online bets per month, and the majority of that volume falls on match-winner and handicap markets. HT/FT receives less attention, which means the pricing is less refined and the edges are wider.
The expected match-winner margin connects your half-by-half analysis to the overall result. If you expect a comfortable home win by 15+ points, the probability distribution shifts heavily toward Home/Home because a 15-point winning margin is difficult to achieve without leading at both intervals. If you expect a tight match decided by a single score, the probability spreads more evenly across multiple HT/FT outcomes, and the Draw combinations become more attractive. For a deeper look at how margin analysis feeds into market selection, winning margin rugby betting covers the quantitative side in detail.
Timing and Conditions That Shift HT/FT Probabilities
I learned early in my career that HT/FT markets are more sensitive to match conditions than standalone winner or handicap markets. Weather is the most obvious factor. Rain suppresses scoring in both halves, but it disproportionately affects first halves because teams have not yet adapted to the conditions. A rainy Premiership fixture is more likely to produce a drawn first half than a dry one, which makes the Draw/Home and Draw/Away outcomes relatively more probable.
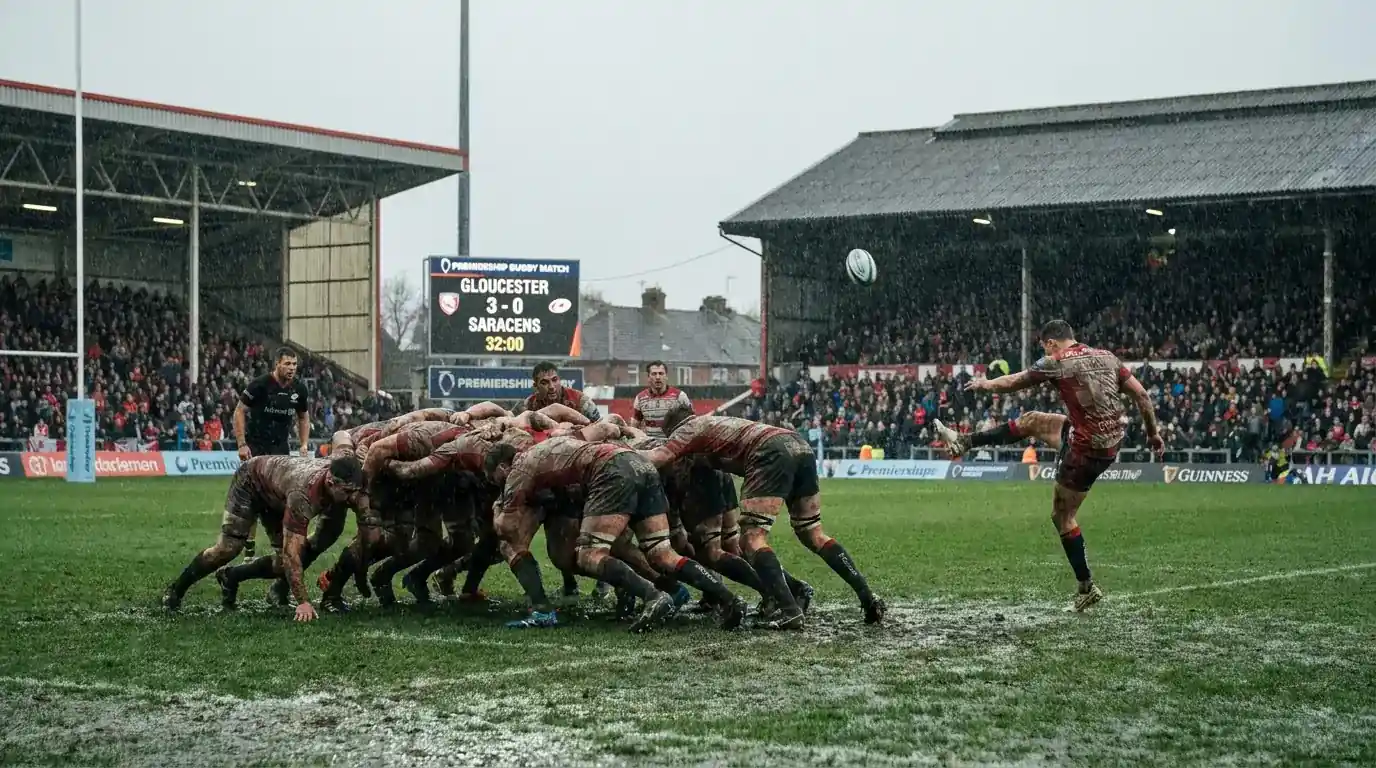
Fixture scheduling matters too. A side playing its third match in fourteen days — common during congested periods of the Premiership or during autumn international windows — is more likely to start slowly. Fatigued teams take longer to reach match intensity, which increases the probability of a level or opposition-led first half even if the fatigued side ultimately has enough quality to win. These are not speculative edges. They are observable patterns that repeat across seasons and competitions.
The final variable is stakes. In high-stakes knockout matches — World Cup quarter-finals, Champions Cup semi-finals — teams play conservatively in the first half because the cost of falling behind is too great. Both sides prioritise not losing over actively winning, which compresses the first-half scoring range and pushes Draw/X outcomes into significantly higher probability territory than the bookmaker’s model acknowledges. The global rugby market stands at $6.9 billion and is projected to reach $11.9 billion by 2033, and as it grows, niche markets like HT/FT will see more sophisticated pricing — but for now, the edges remain accessible to bettors who study the shape of matches rather than just the final score.
What does the HT/FT market mean in rugby betting?
The HT/FT market asks you to predict which side is leading at half-time and which side wins at full-time. There are nine possible outcomes: three half-time possibilities (home, draw, away) multiplied by three full-time possibilities. A draw at half-time combined with a home win at full-time is a separate outcome from the home side leading at both intervals. Each combination has its own odds.
Is the HT/FT market available for all rugby matches?
Most major UK bookmakers offer HT/FT markets on international matches, Six Nations fixtures, Premiership matches and major tournament games. Availability for lower-profile domestic fixtures — Championship matches, early-round Challenge Cup ties — varies between operators. If you plan to bet HT/FT regularly, check which operators offer the widest coverage across the competitions you follow.
Prepared by the Rugby Betting Tips editorial staff.