Rugby Union vs Rugby League Betting: Every Difference That Affects Your Stake
 Available in US

Table of Contents
- Two Codes, Two Completely Different Betting Playbooks
- Scoring Systems and What They Mean for Over/Under Lines
- Pace, Tempo and In-Play Implications
- Which Code Offers More Betting Markets
- The Stats That Matter in Each Code
- Tournaments Worth Betting On: Union Calendar vs League Calendar
- Advice for Bettors Crossing Between Codes
- Frequently Asked Questions
Two Codes, Two Completely Different Betting Playbooks
The first time I applied a Union betting strategy to a Super League match, I lost three bets in a single afternoon. Handicap lines that felt generous turned out to be tight. Totals that looked inflated sailed past comfortably. Try-scorer picks based on positional logic from Union were irrelevant in a game where forwards score from close range as often as backs finish in open play. That afternoon taught me something I should have known already: Rugby Union and Rugby League share a name and a ball shape, but from a betting perspective, they are different sports.
The global rugby market — both codes combined — is valued at $6.9 billion in 2025 and projected to reach $11.9 billion by 2033. That growth is not evenly distributed. Union dominates the international calendar and the premium broadcast slots, while League is expanding its footprint through faster-paced, higher-scoring matches that attract a younger audience and a growing share of betting volume. For punters in the UK, both codes offer deep markets at licensed bookmakers, but the analytical framework you bring to each needs to be fundamentally different.
This guide maps every difference that matters for your betting: scoring systems, game pace, market depth, the stats worth tracking and the tournament calendars that shape when and where your money is best deployed. If you bet on Union and have never seriously looked at League — or vice versa — the opportunity cost of ignoring the other code is significant.
Scoring Systems and What They Mean for Over/Under Lines
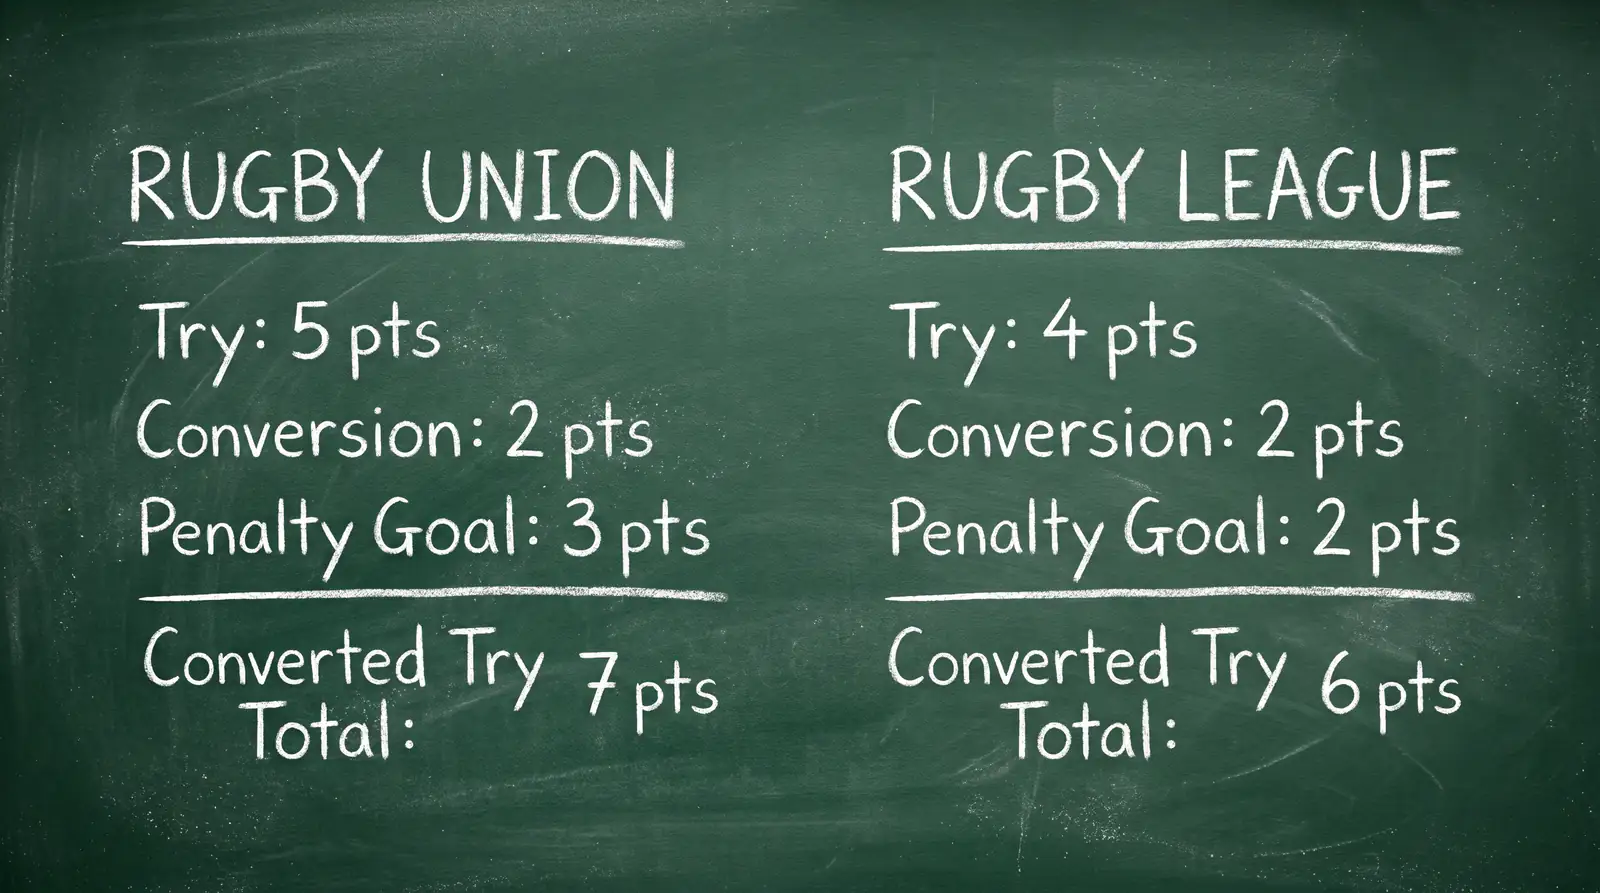
The numbers look similar at first glance, but they create entirely different betting landscapes. In Union, a try is worth 5 points and the conversion adds 2, making a converted try worth 7. A penalty goal or drop goal scores 3. In League, a try is worth 4 points and the conversion adds 2, making a converted try worth 6. There is no drop goal in regular play (League removed it from most competitions), and penalty goals are worth 2 points.
Those differences might seem marginal. They are not. In Union, the 7-3 scoring structure means that a team can stay competitive through penalty goal accumulation without ever crossing the try line. A match where one side scores three penalties and the other scores two converted tries finishes 9-14 — a total of 23 points. In League, the 6-2 structure makes penalty goals almost irrelevant to the scoreboard. Points come from tries, and tries come frequently. A typical Super League match features more tries than a typical Premiership fixture because the rules are designed to keep the ball in play and create more attacking opportunities.
For over/under betting, this changes everything. The 2025 Six Nations averaged 55 points per match across fifteen fixtures. A typical Super League round comfortably exceeds that average, with individual games regularly crossing 50 points and combined totals above 60 not unusual. When you see a totals line of 42.5 on a Six Nations match, that number sits near the centre of the probable distribution — some games will go over, some under, and the bookmaker’s line represents a genuine coin-flip proposition. When you see a totals line of 42.5 on a Super League match, it is set significantly below the average, suggesting the bookmaker expects a tighter, lower-scoring game than normal. The same number carries completely different meaning in each code.
The conversion rate also matters more than most bettors realise. In Union, conversions are taken from a spot perpendicular to where the try was scored. A try under the posts gives an easy conversion directly in front; a try in the corner produces a difficult angled kick from the touchline. In League, conversions follow the same rule, but the higher try volume means conversion success rates have a larger cumulative effect on the total score. A kicker who goes 7 from 7 on conversions in a League match adds 14 points. One who goes 4 from 7 adds 8. That 6-point swing, over the course of a high-scoring game, can be the difference between over and under.
My rule of thumb: in Union, assess the totals market through the lens of penalty counts and kicking accuracy, because penalties contribute a meaningful share of the total. In League, assess it through try-scoring frequency and defensive line speed, because tries are almost the entire story. The analytical inputs are different even though the market format is identical.
Pace, Tempo and In-Play Implications
Watch a Union match and a League match back to back and the difference in speed is visceral. Union is a contest of territory, set-piece dominance and structured phases. League is a contest of completing your sets, exploiting the defensive line and turning field position into points before the other side gets the ball back. That tempo difference is not just aesthetic — it fundamentally changes how in-play markets behave.
In Union, the ball spends significant time in uncontested phases: scrums resetting, lineouts being called, teams walking back for penalty kicks. These pauses create natural windows for in-play bettors to assess the state of play and place considered bets. Odds update more slowly because the game moves more slowly. If a try is scored in Union, the market adjusts, but you typically have 60-90 seconds during the conversion attempt and restart to evaluate the new odds before the next sequence of play begins.
In League, the ball is in play for a higher percentage of match time. Sets of six tackles create a relentless rhythm, and the transition from attack to defence is near-instantaneous. When a try is scored, the restart happens quickly, and the odds move in real time. The window for in-play assessment is shorter, the volatility is higher, and the pricing swings more dramatically. A League match can see three or four tries scored in a ten-minute spell, each one reshaping the in-play handicap and totals markets. Union rarely produces that kind of rapid-fire scoring.
For in-play bettors, the practical implication is clear. Union in-play suits a deliberate, analytical approach — watching set-piece trends, penalty counts and territorial dominance to anticipate the next scoring event before it happens. League in-play rewards reactive speed — reading momentum shifts, spotting fatigue in a defensive line and acting on odds movements within seconds. I treat them as entirely separate disciplines, and I would not recommend a bettor new to in-play rugby start with League. The pace is unforgiving. Start with Union, learn to read the ebb and flow, then graduate to League’s higher tempo once your in-play instincts are calibrated.

Which Code Offers More Betting Markets
I sometimes hear bettors dismiss League as having “fewer markets” than Union. That was true five years ago. It is no longer accurate, at least not at the major UK operators.
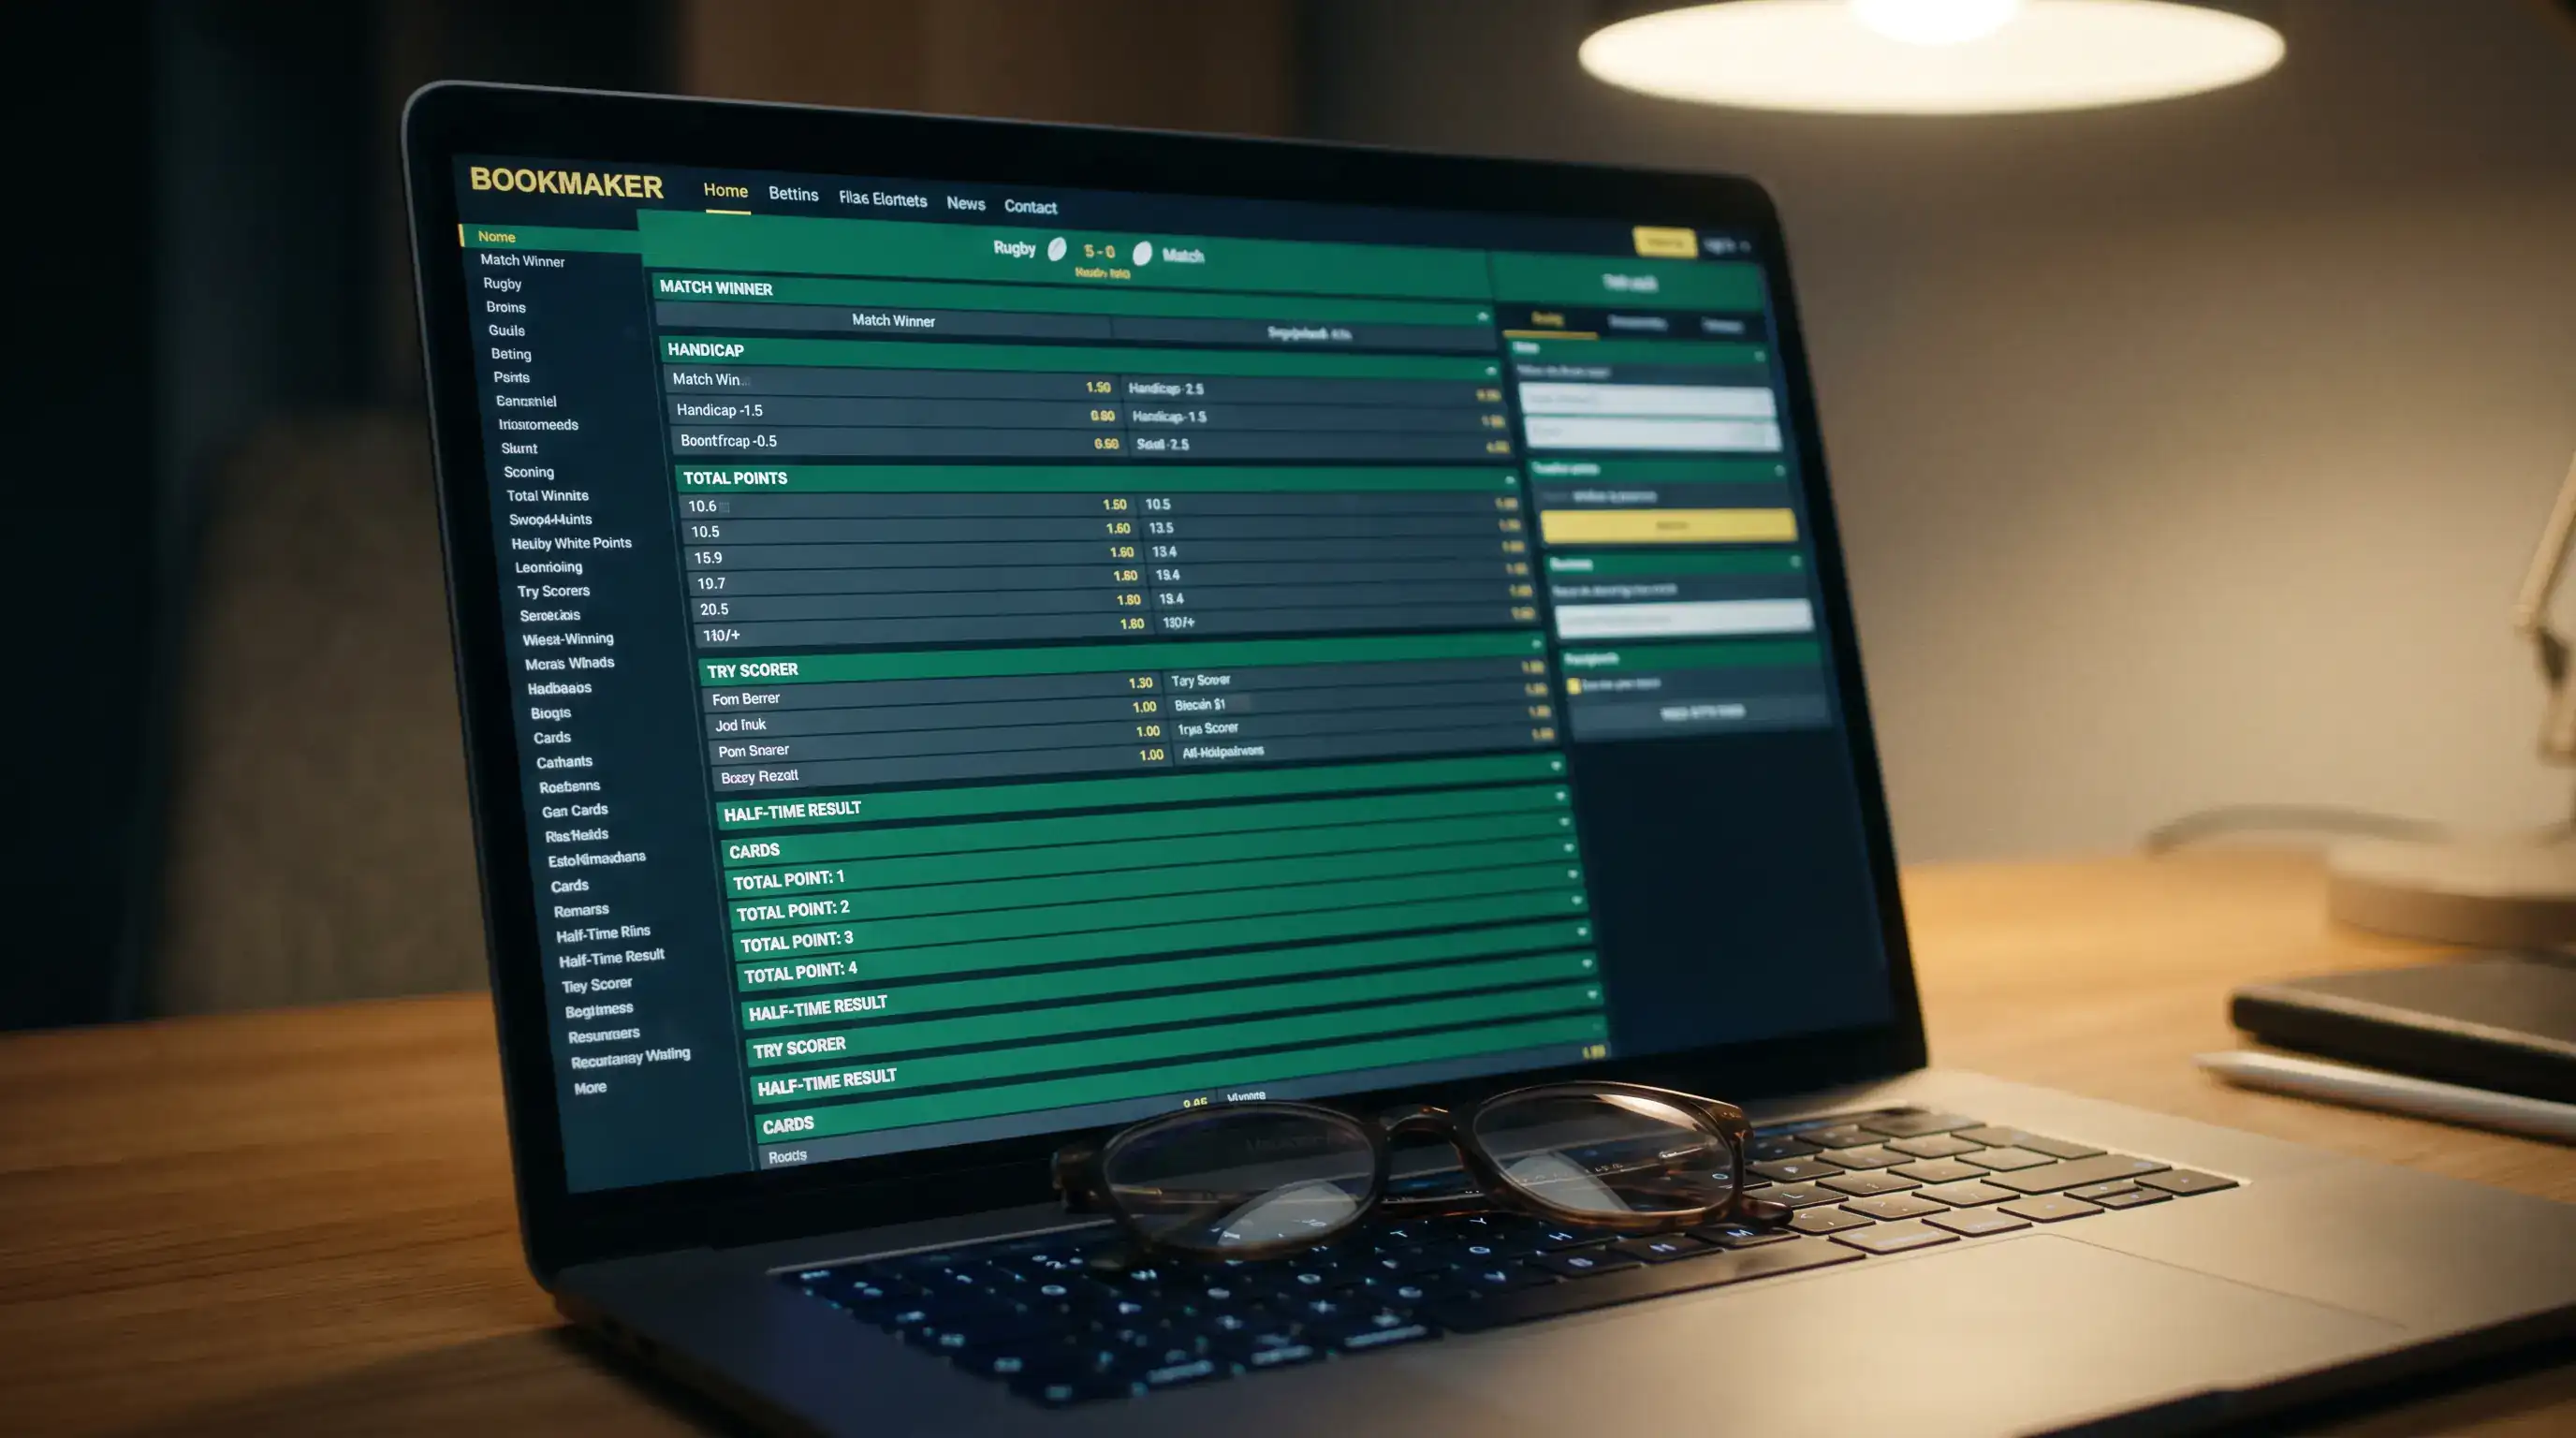
Union’s international fixtures — particularly Six Nations and World Cup — attract the deepest market coverage of any rugby event. A Six Nations match at a top-tier operator might offer 80-100 individual markets: match winner, handicap variants, totals, half-time/full-time, try-scorer props, penalty counts, cards, margin bands and various bet-builder options. That depth reflects the commercial importance of Union internationals and the volume of betting traffic they generate. The global sports betting market, worth $125.12 billion in 2026, flows disproportionately toward events with the largest audiences, and Union internationals sit firmly in that category.
Domestic Union — Premiership, United Rugby Championship, Top 14 — typically offers 40-60 markets per match, depending on the operator and the profile of the fixture. A Premiership semi-final gets close to international-level depth. A mid-season league match between mid-table sides gets less attention, and the market range reflects that.
League has closed the gap significantly. A Super League fixture at the same operator now offers 50-70 markets, including League-specific propositions that do not exist in Union: race to 10 points, race to 20 points, highest-scoring half, tackles over/under and completion-rate props. These League-specific markets are where I find some of my best value, precisely because they are newer and the bookmaker’s pricing models for them are less refined than for the established Union markets.
The NRL — Australia’s National Rugby League — pushes market depth even further. An NRL fixture at a UK operator with strong Australian coverage can offer 80+ markets, rivalling a Six Nations match. The catch is that NRL market depth varies enormously between operators. Some UK bookmakers treat NRL as a secondary product and offer minimal coverage. Others, particularly those with Australian parent companies, provide full-depth markets with competitive odds. Knowing which operator covers your code best is as important as the analysis itself.
One area where Union still leads convincingly is outright and futures markets. You can bet on the Six Nations champion, Premiership winner, World Cup winner and Grand Slam months in advance, with competitive odds and multiple operators to compare. League outrights exist — Super League winner, Challenge Cup winner — but the market is thinner, the odds are wider and fewer operators offer them early in the season.
The Stats That Matter in Each Code
If you gave me one stat for each code and told me to bet on that alone, here is what I would pick. For Union: scrum and lineout success rate. For League: completion rate. Those two numbers capture more of what drives outcomes in each code than anything else, and they are available for free from public stats providers.
In Union, set-piece dominance — scrums and lineouts — dictates territory, possession and penalty count. A team winning 90% or more of their own scrums and lineouts is controlling the platform from which all attacking play launches. When that rate drops below 80%, the team is under structural pressure that translates into conceding penalties, losing territorial advantage and — critically for bettors — falling behind on the scoreboard in ways that make handicap covers difficult. I track set-piece rates per team across their last four competitive fixtures and flag any deviation of more than 5% from the norm, because that deviation usually signals either a personnel change in the front row or a tactical vulnerability that the opposition can exploit.
In League, the completion rate — the percentage of sets where the attacking team completes all six tackles without losing possession — is the single most predictive stat for match outcomes. A team completing above 80% of their sets is building sustained pressure. A team below 70% is handing the ball back repeatedly, and in League’s fast-tempo environment, turnovers translate into points with alarming speed. Completion rate also feeds directly into totals betting: higher combined completion rates mean more sustained attacking sets, more entries into the attacking zone and more points. Lower completion rates create chaotic, error-strewn games where the total can swing wildly.

Beyond the headline numbers, each code has secondary stats worth watching. In Union: tackle success rate, penalties conceded per match and metres carried by forwards versus backs. In League: tackles made, metres gained from dummy-half runs, line breaks and offloads. The key difference is that Union stats tend to be structural — they describe how the set-piece and defensive system is functioning — while League stats tend to be dynamic — they describe how individual efforts accumulate into scoring momentum.
One universal stat applies to both codes: discipline. Penalty counts predict losing. The team that concedes more penalties loses more often across both Union and League, regardless of other performance metrics. Penalty data is the easiest stat to track and the most consistently predictive, yet most casual bettors never look at it.
Tournaments Worth Betting On: Union Calendar vs League Calendar
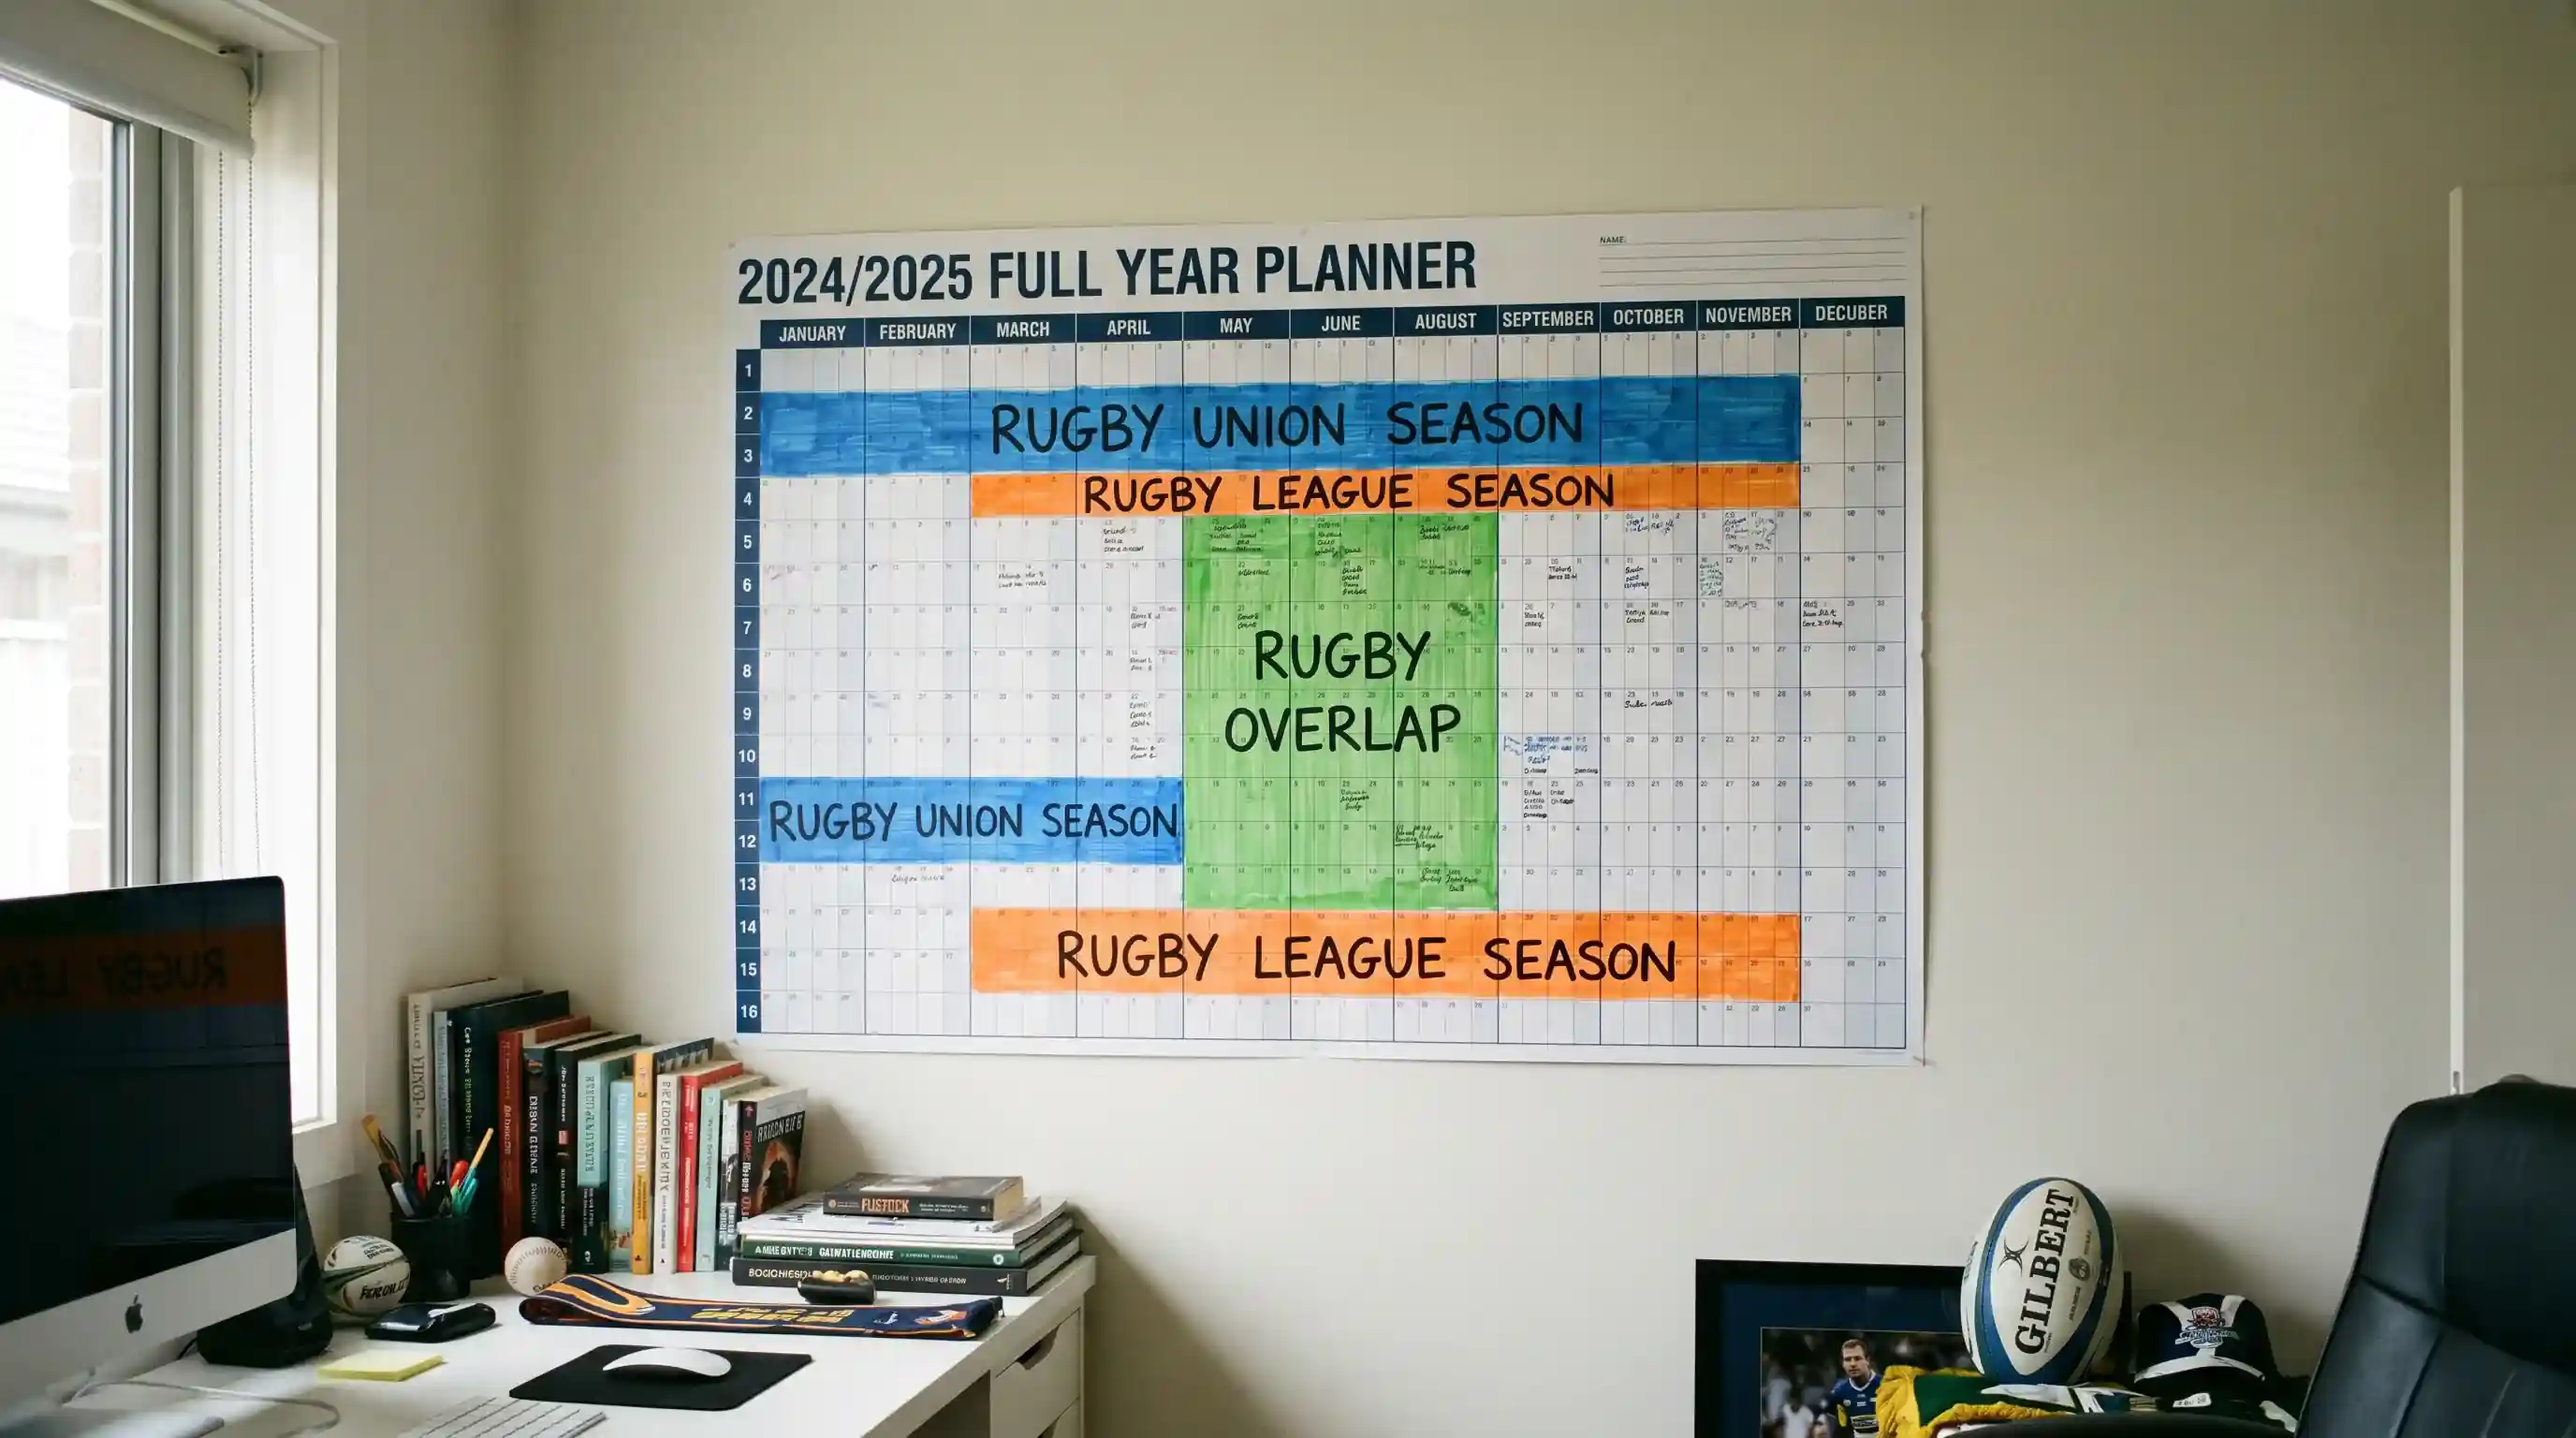
The two codes run on almost opposite schedules, and that is a gift for bettors who follow both. Union’s premium events cluster in the European winter and spring — Six Nations from February to March, autumn internationals in November, Premiership and Champions Cup running September to June. League’s Super League runs from February to October, the NRL from March to October, and the Challenge Cup fills gaps across the spring and summer. Follow both codes and you have meaningful rugby betting opportunities virtually year-round.
The Six Nations is the jewel of Union’s calendar for betting purposes. Fifteen matches over five weekends, with $135.24 million in media revenue in 2025 and the deepest market coverage of any rugby event. The World Cup, when it comes around every four years, eclipses everything else in both volume and variety, but the Six Nations is the annual anchor. The Premiership and Champions Cup offer week-in, week-out betting through the club season, though market depth drops noticeably for mid-table fixtures.
Super League is the entry point for League betting in the UK. Twenty-seven regular-season rounds plus play-offs give you a long runway of fixtures with increasingly mature markets. The Challenge Cup adds knockout-format betting, where different dynamics — no second chances, neutral venues in later rounds — create different value patterns. For bettors willing to look beyond UK borders, the NRL offers UK punters a rich market with a time-zone advantage: matches kick off in the Australian evening, which is early morning in the UK, giving you access to overnight odds movements that casual British bettors are asleep for.
The prize fund and sponsorship money behind each tournament directly affects how seriously bookmakers treat it. The Six Nations’ GBP 18 million prize pot and Guinness’s GBP 15 million annual title sponsorship keep it at the top of every operator’s rugby offering. Super League’s commercial profile is smaller but growing, and the introduction of IMG’s grading system has raised the standard of competition and — by extension — the reliability of statistical patterns that bettors depend on.
My calendar approach is straightforward. November to March: Union-heavy, focusing on autumn internationals, Six Nations and Champions Cup. April to September: shift weight toward League, with Super League providing the bulk of weekly action and NRL filling the early mornings. October: overlap month where both codes offer competitive fixtures simultaneously, and the betting bankroll needs to be carefully allocated between the two.
Advice for Bettors Crossing Between Codes
An independent review in the Smart Betting Club’s 161st issue found that a dedicated rugby service had returned 10.54% ROI across 485 selections over twelve months — and the reviewer attributed the edge specifically to code-specific rigour. That discipline matters doubly when you are crossing between Union and League, because the habits you build in one code can actively mislead you in the other.
The first thing to reset is your sense of what constitutes a “normal” scoreline. In Union, a 24-17 result is a competitive match with a clear winner. In League, 24-17 suggests a tight, defensive contest. If you carry Union’s scoring expectations into League markets, your totals bets will be consistently wrong — you will take “under” when the game sails past the number. The recalibration takes time. I spent a full Super League season tracking actual versus expected totals before my League instincts were reliable enough to bet with conviction.
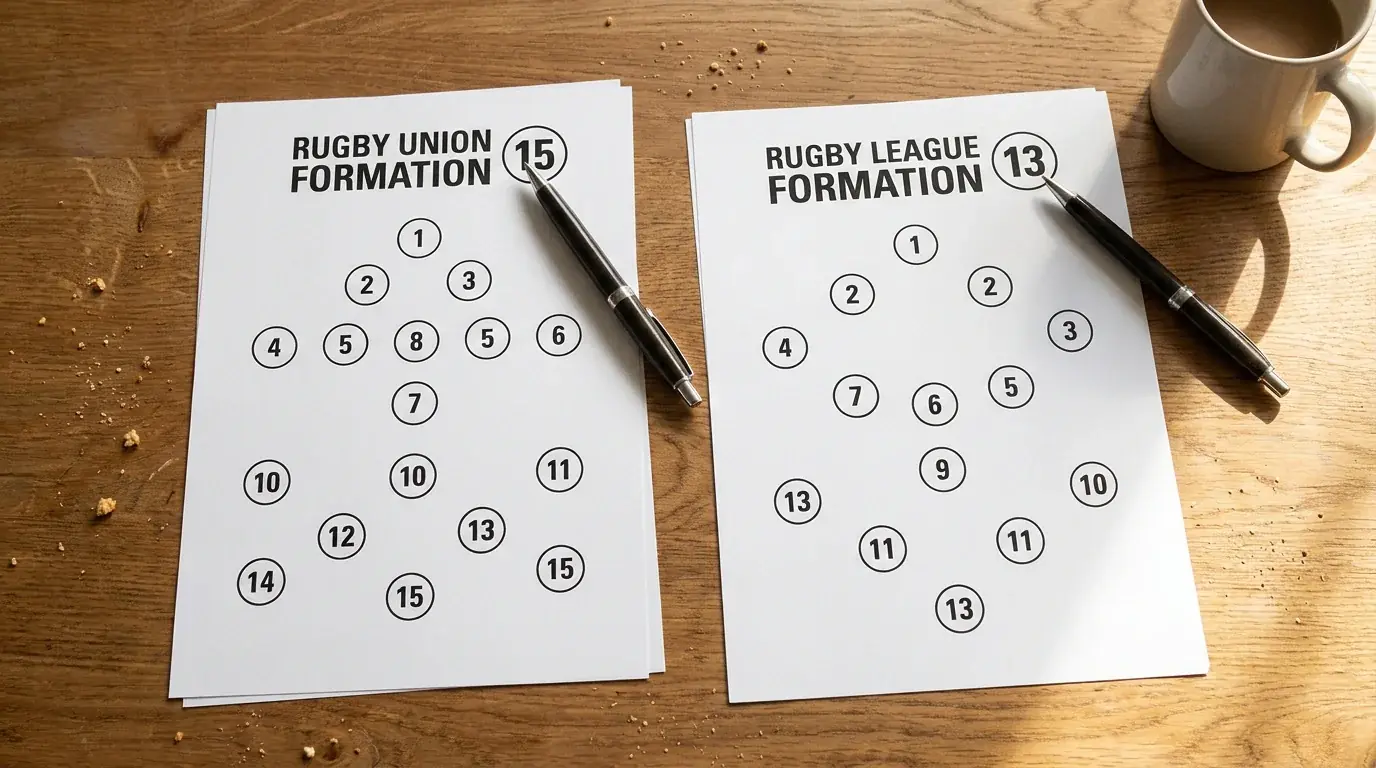
The second adjustment is positional awareness. Union has fifteen positions on the field, each with a distinct role. The fly-half controls the game, the hooker throws at lineouts, the wings finish in open play. In League, thirteen players take the field, and the positional specialisation is less rigid. Forwards carry the ball in structured sets, halves distribute, but the boundaries blur more than in Union. Try-scorer markets reflect this: in Union, wing and back-three players dominate the first-tryscorer stats. In League, back-rowers and hookers score from close range with far greater frequency. If you pick try scorers based on Union logic, you will overvalue League backs and undervalue League forwards.
The third shift is how you think about substitutions. Union allows eight replacements, and the tactical use of the bench — particularly the front-row rotation around 50-60 minutes — has a measurable impact on second-half scoring. A team with a stronger bench tends to pull away late in Union. League allows only four interchanges (in NRL; Super League rules may differ), and fatigue management is a more constant factor. League teams cannot simply refresh their pack at the hour mark. Instead, they cycle interchanges throughout the match, meaning the bench impact is distributed rather than concentrated. For handicap bettors, this means second-half pull-aways are more common in Union and less reliable as a pattern in League.
My final piece of advice: do not try to apply your Union model to League data or your League model to Union data. Build separate frameworks. Track separate stats. Maintain separate bankrolls if it helps you compartmentalise. The effort of learning both codes properly is real, but the reward is a twelve-month betting calendar with no dead period and twice the opportunity set.
Frequently Asked Questions
Why are total-points lines higher in Rugby League than in Union?
League’s rules are designed to maximise ball-in-play time and try-scoring opportunities. There are no contested scrums to slow the game, no lineouts to reset possession, and the six-tackle rule forces teams to attack rather than hold the ball. The result is more tries, more points and higher totals lines. A typical Super League fixture might see a totals line of 44-50, while a Six Nations match between two defensive sides could sit at 38-42. The scoring systems also differ — a converted try is worth 6 in League versus 7 in Union — but the volume of tries more than compensates for the lower per-try value.
Which code has more prop-bet markets at UK bookmakers?
League generally offers more code-specific prop markets because its faster pace and higher try count create additional betting angles. Markets like race to 10 or 20 points, highest-scoring half and tackles over/under are common in League but rare or nonexistent in Union. Union counters with prop markets around set-piece events — penalty count, lineout steals, scrum penalties — that do not translate to League. Overall, the total number of proposition markets on a headline fixture is comparable, but the composition is different.
Can the same betting strategy work for both Union and League?
General principles — bankroll management, line shopping, expected-value thinking — apply equally to both codes. But the specific analytical framework should be different. The stats that predict outcomes in Union (set-piece success, penalty count, kicking accuracy) are not the stats that predict outcomes in League (completion rate, metres gained, line breaks). Applying one code’s strategy to the other without adjustment is one of the most common mistakes crossover bettors make.
How does the sin-bin rule difference affect in-play betting in each code?
In Union, a yellow card removes a player for 10 minutes, creating a 15-vs-14 numerical advantage. The impact is significant — the team with the extra player scores more frequently during the sin-bin window, and in-play odds adjust sharply. In League, a sin-bin lasts 10 minutes as well but the numerical advantage is 13-vs-12, which creates relatively more space because the field dimensions are the same. League sin-bins tend to produce tries more reliably than Union yellow cards, making them a stronger in-play trigger for bettors watching live.
Created by the ”Rugby Betting Tips” editorial team.