Winning Margin Rugby Betting: Scoring Ranges, Odds and Edge-Finding
 Available in US

Winning-Margin Bets Ask How Much, Not Just Who
I backed an outsider to win a Six Nations match by 1 to 12 points at 7/1. They won by 9. The match-winner odds on the same side had been 3/1. Same outcome, same analysis — but the winning-margin bet paid more than double because it rewarded precision. That is the fundamental appeal of margin betting: it converts your conviction about the nature of the result into a higher-paying wager.
Winning-margin markets divide the possible final score difference into bands — typically 1-12 points, 13-24 points, 25+ points, and sometimes tighter bands within those ranges. You pick the winning team and the margin band you expect the result to fall into. The narrower and more specific your prediction, the longer the odds. It is a market that sits between the simplicity of match-winner and the complexity of correct-score, offering a middle ground where informed analysis can generate genuine value.
How Winning-Margin Markets Are Structured
Most UK bookmakers structure rugby winning-margin markets around four to six bands per side, plus a draw option where applicable. The standard bands are: 1-12 points, 13-18 points, 19-24 points, 25-30 points and 31+ points. Some operators offer tighter bands for high-profile fixtures — 1-6, 7-12, 13-18, 19-24, 25+ — which increases the number of possible outcomes and pushes the longer-priced selections further out.
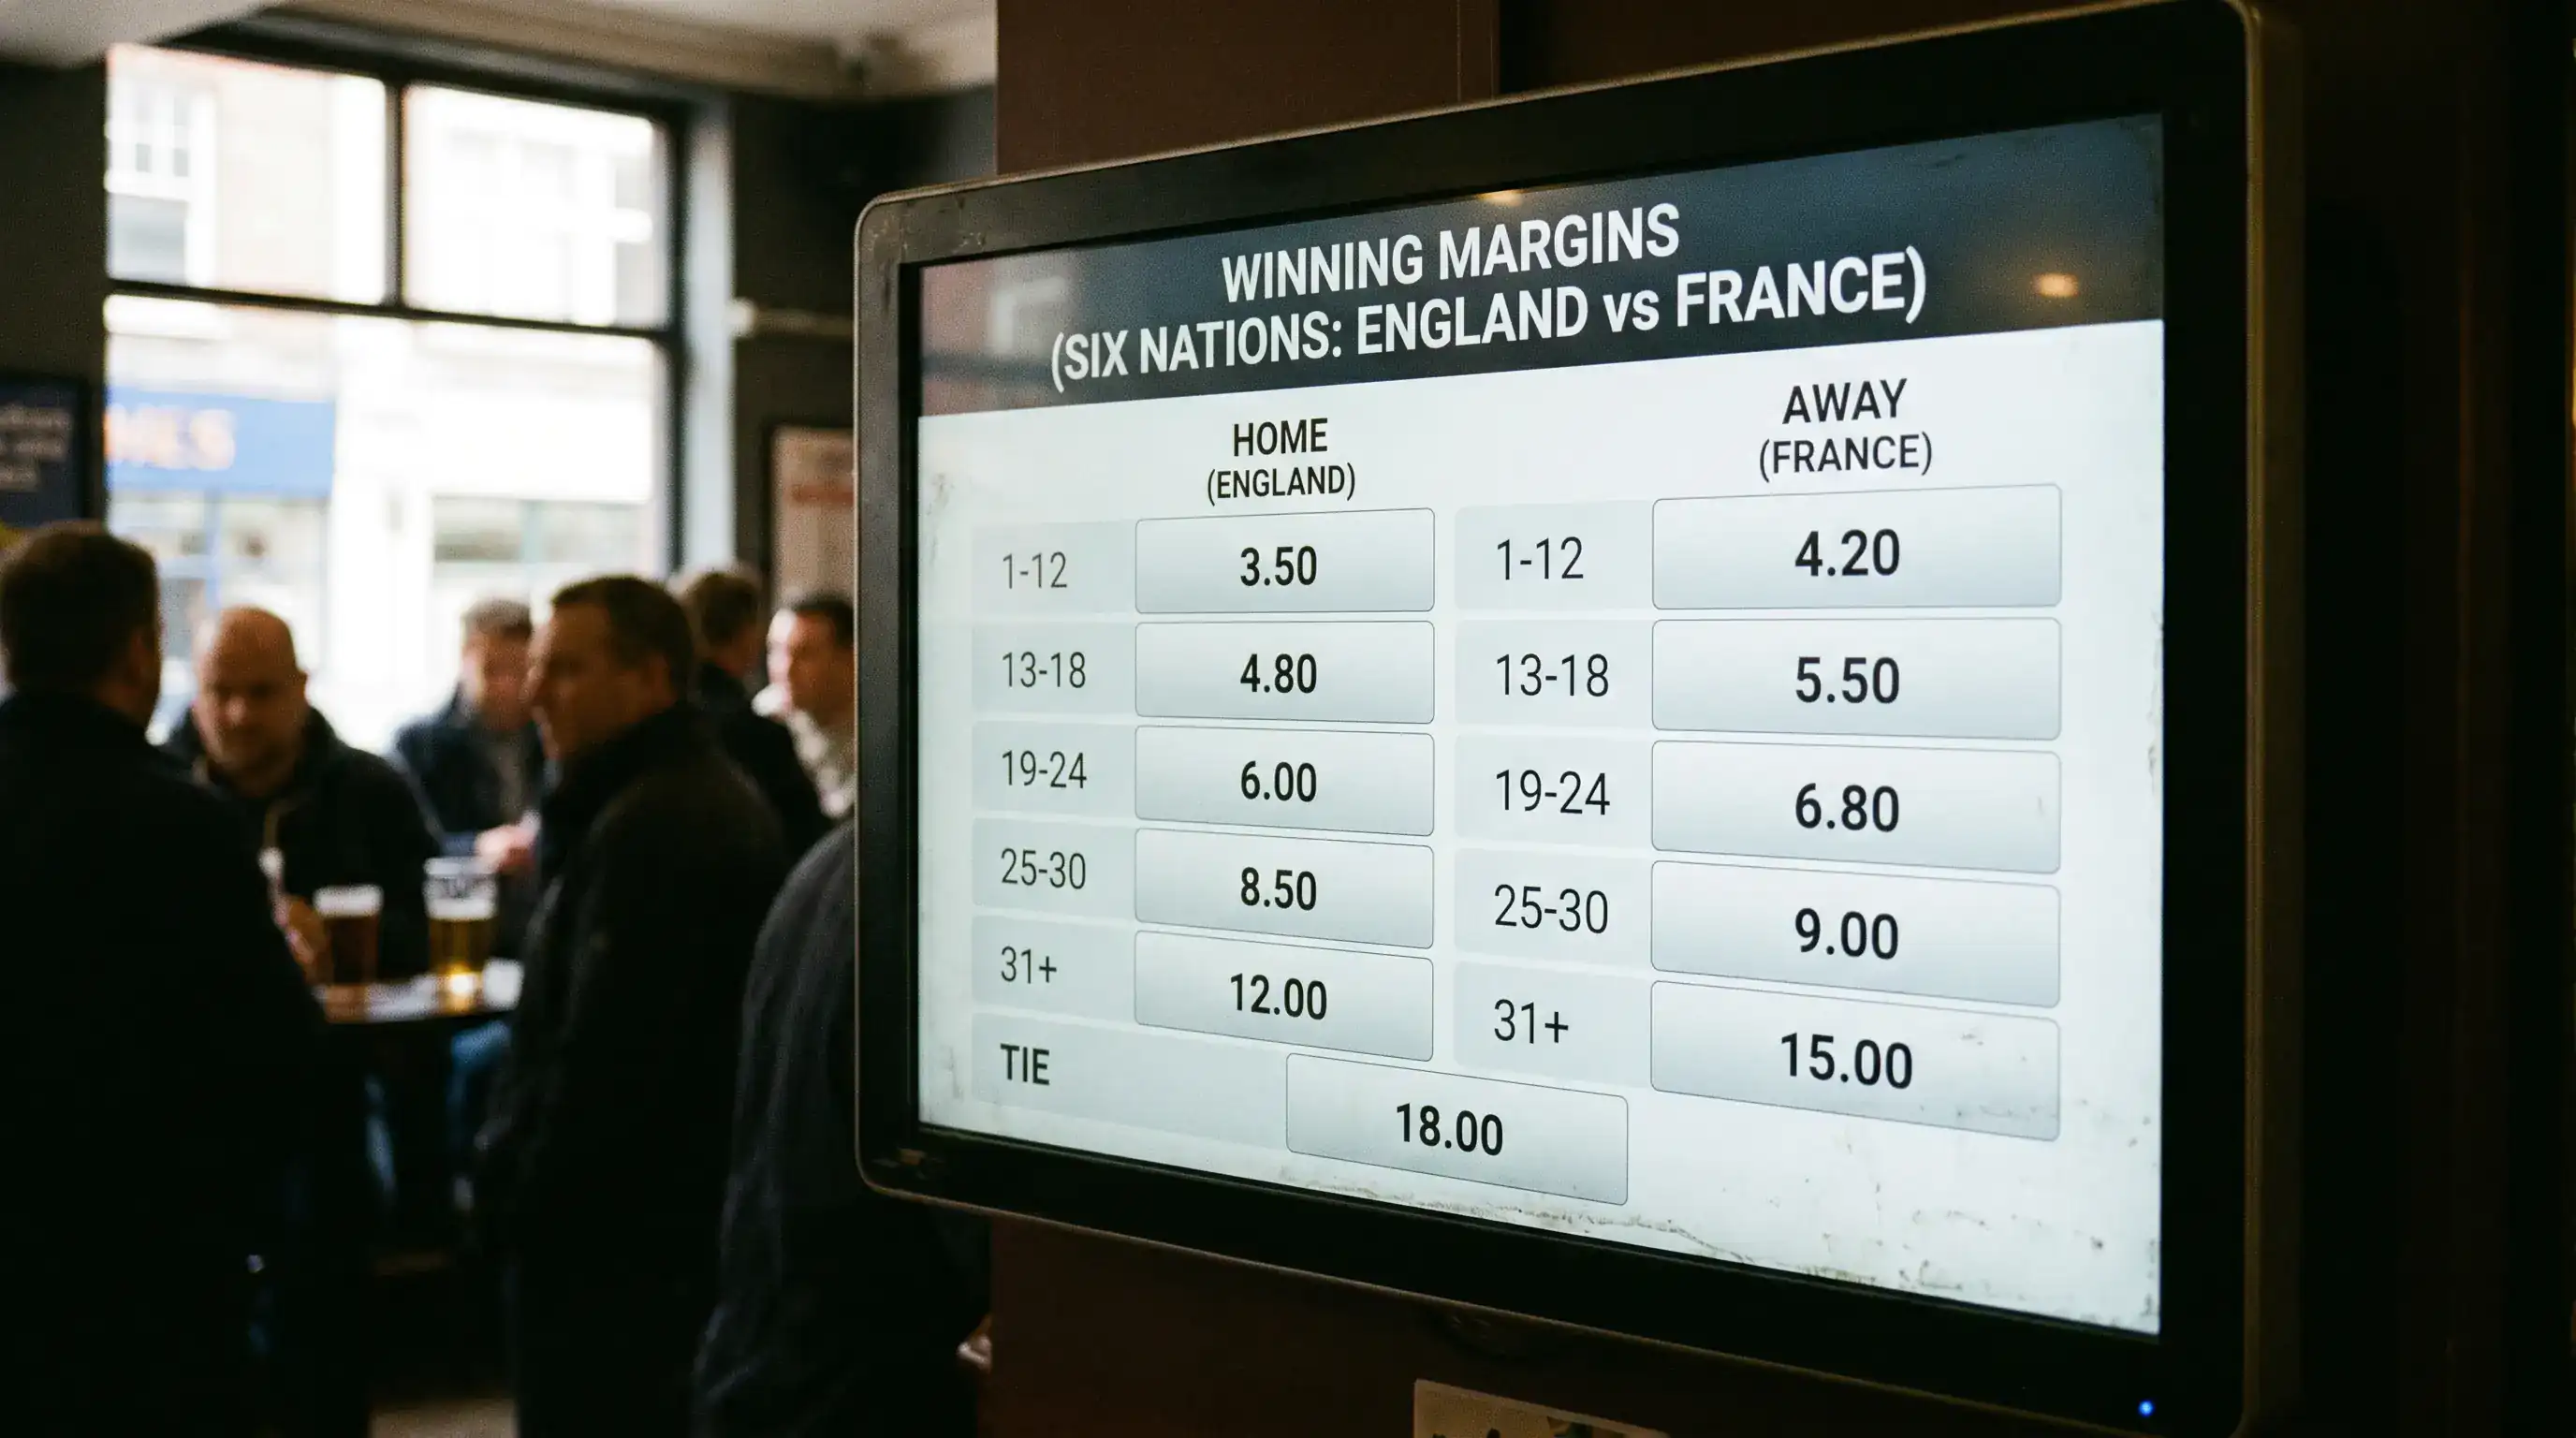
The Six Nations 2025 averaged 55 points per match, and France alone scored 218 points across their five fixtures. In high-scoring tournaments, the margin distribution skews toward wider bands because the absolute points difference between strong and weak sides inflates. A side averaging 40+ points per match is capable of winning by 30 or more against a weaker opponent, which means the 25+ or 31+ band carries a higher probability than it would in a low-scoring competition.
Bookmakers price each band by estimating the probability distribution of the final margin. They model the expected score for each side, calculate the likely difference, and then assign probabilities to each band based on the distribution around that expected margin. The overround on winning-margin markets is higher than on match-winner markets — typically 15-25% — because the larger number of outcomes allows the bookmaker to build margin into every selection without any single price looking unreasonable to the casual eye.
For the bettor, the practical implication is that winning-margin markets are structurally more expensive than handicap or totals markets. You pay a premium for the enhanced odds, and that premium means your analysis needs to be sharper to generate positive expected value. I treat winning-margin bets as a supplement to my core handicap and totals portfolio, not a replacement for it.
Historical Margin Distributions by Competition
Understanding how margins distribute across different competitions is the foundation of margin betting. Each tournament and league has its own characteristic pattern, and applying the wrong distribution to a specific fixture is a common and expensive error.


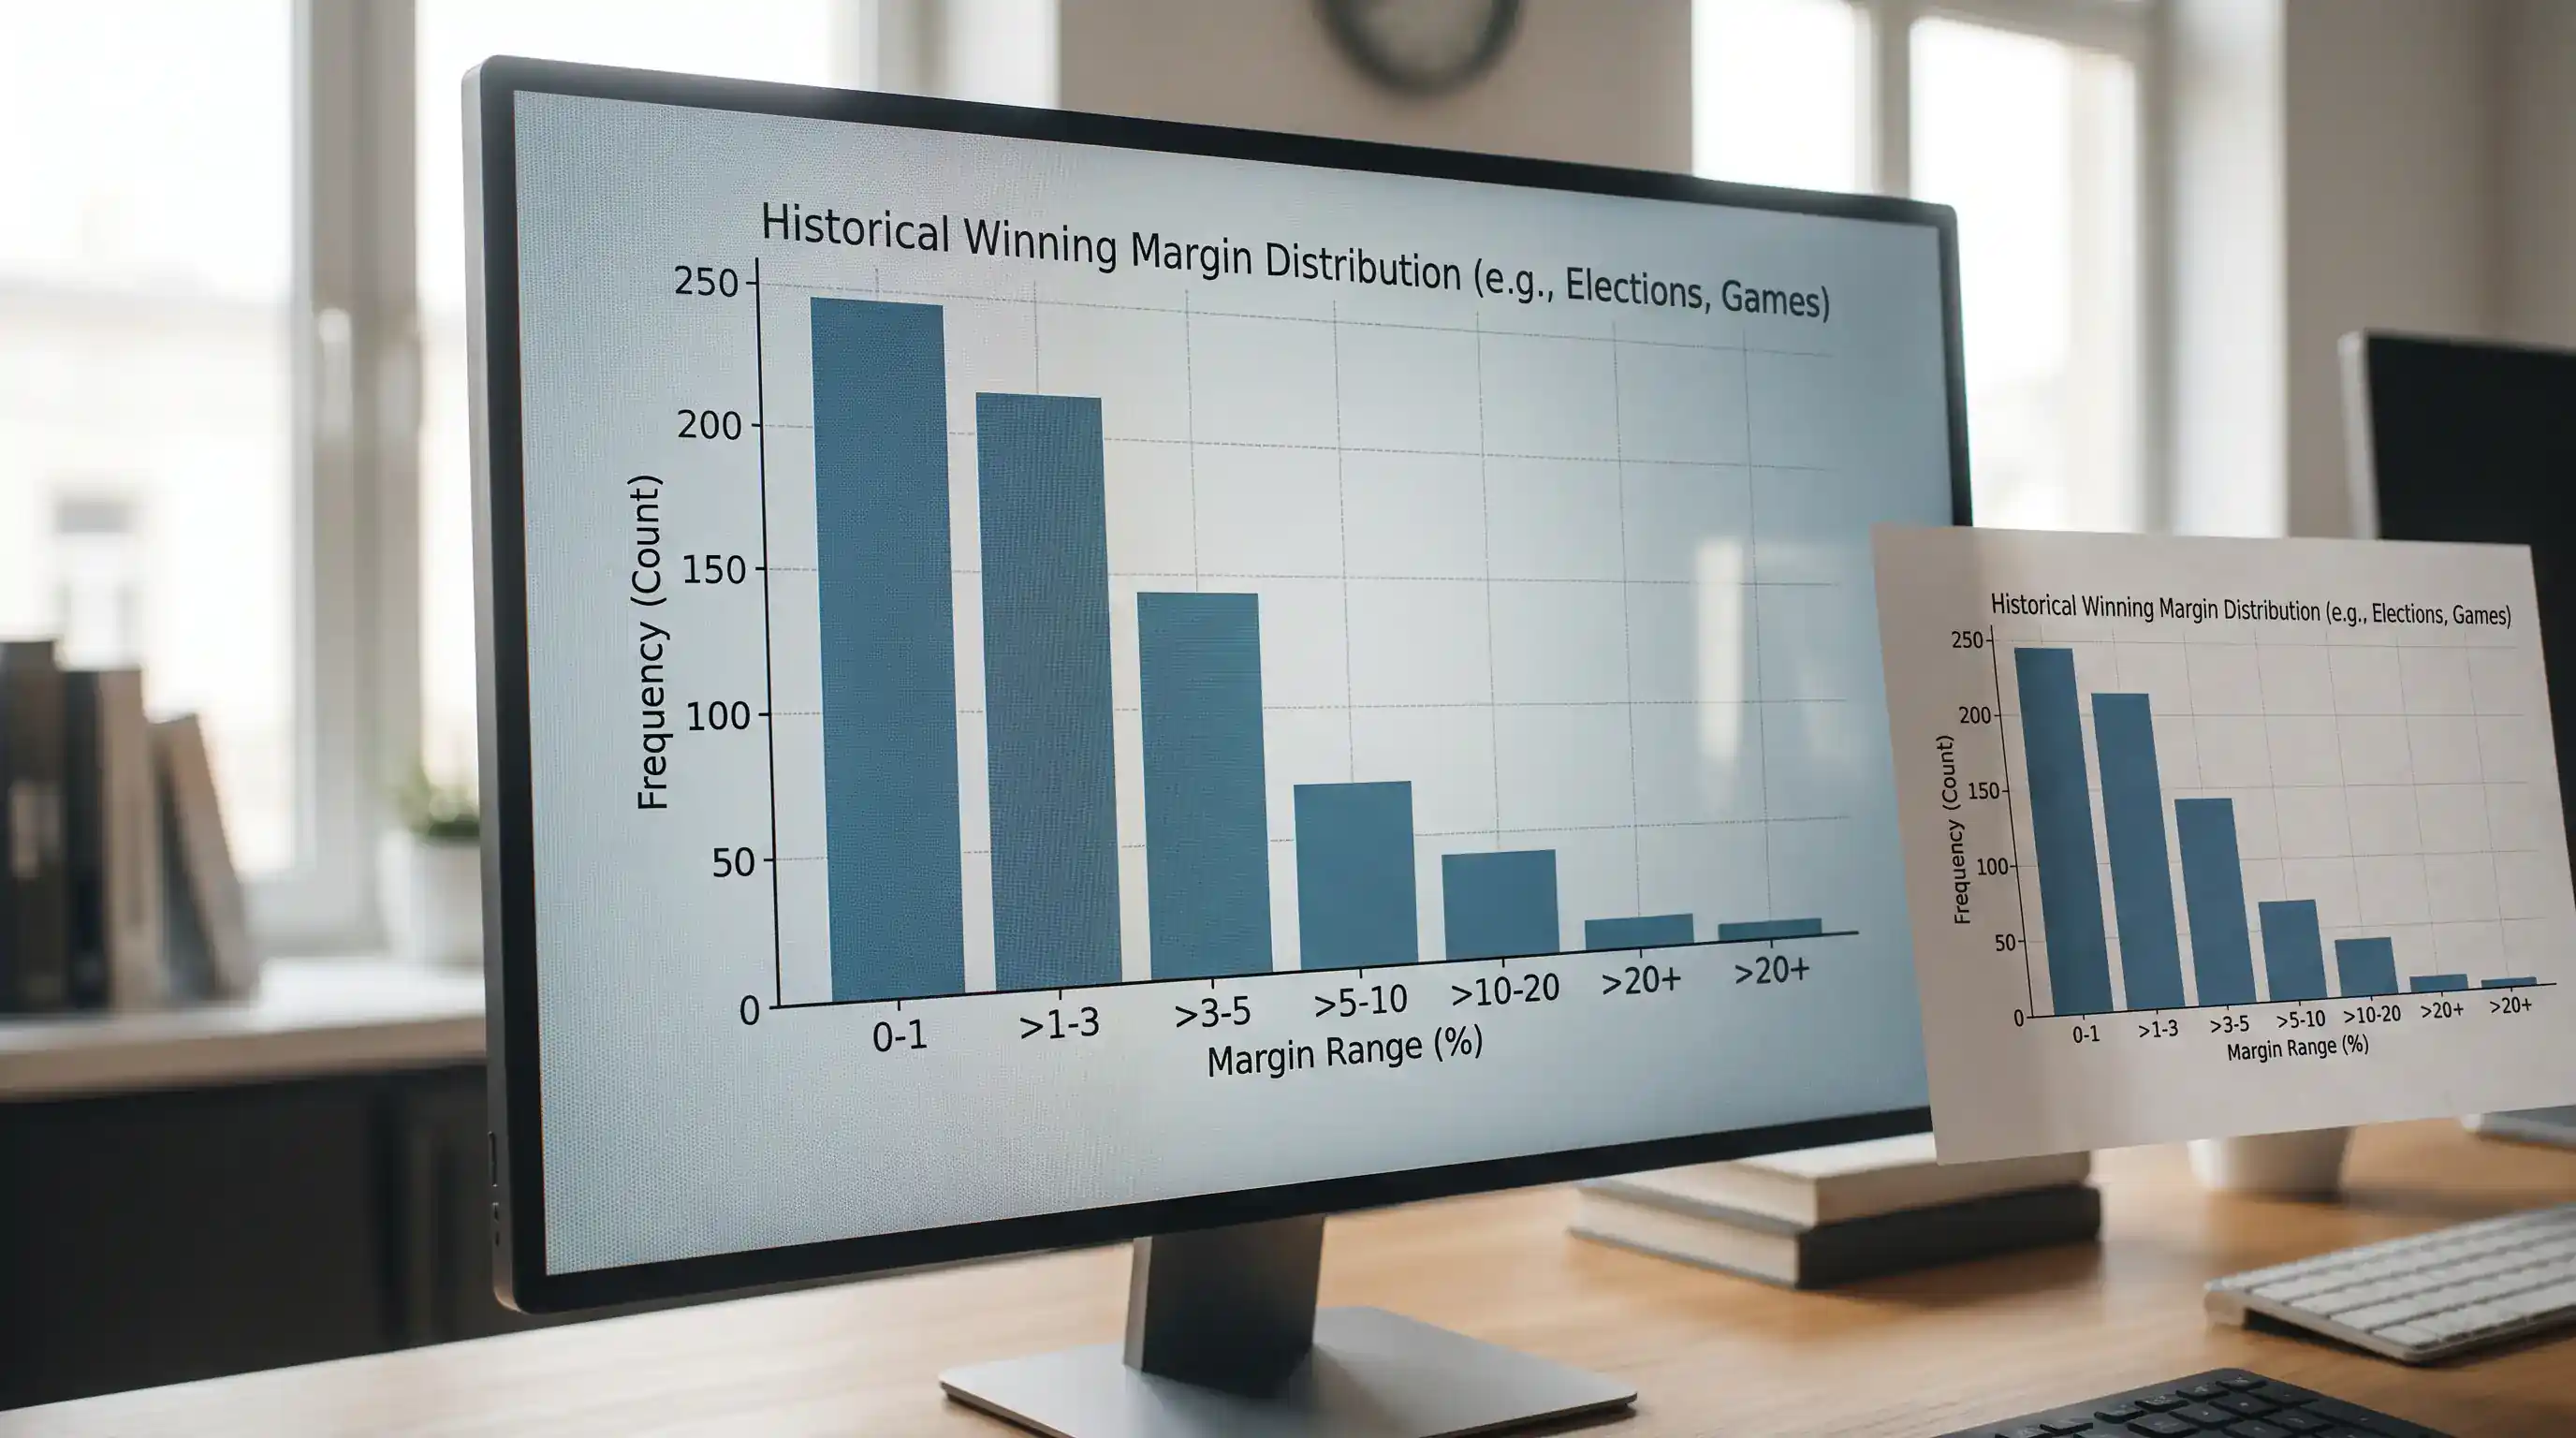
In the Six Nations, the most common winning margin over the last five tournaments falls in the 1-12 band. Roughly 45-50% of all Six Nations matches produce a margin within that range. The 13-24 band captures another 25-30%, and margins above 24 points are relatively rare — perhaps 15% of matches. This skew toward tight margins reflects the competitive balance of the tournament: most Six Nations matches are genuinely contested, and blowouts are the exception rather than the norm.
In the peak match of the 2026 Six Nations, the France-England final produced a 48-46 scoreline — a margin of just 2 points despite a combined total of 94. That match illustrates a critical point: high scoring does not automatically mean wide margins. Two sides can score prolifically and still finish within a single score of each other. The margin and the total are related but distinct variables, and conflating them leads to bad margin bets.
The Premiership shows a wider margin distribution than the Six Nations. Regular-season matches between top-four and bottom-four sides regularly produce margins above 20 points, while matches between evenly ranked sides cluster in the 1-12 range. The play-offs compress the distribution back toward tight margins because the quality gap narrows. A seasonal approach to Premiership margin betting needs to account for this shift: wider bands are more likely in the regular season, tighter bands in the play-offs.
In Rugby League’s Super League, margins tend to be slightly wider on average than in Union’s Premiership because the scoring system (four points per try, no contested set pieces to slow the game) produces more volatile scorelines. A side that breaks clear in League can build a margin quickly through consecutive sets of possession that Union’s breakdown contest does not permit.
Winning Margin vs Handicap: Overlap and Differences
On the surface, winning margin and handicap betting look similar — both ask you to assess the likely points difference. But they are structurally different markets, and understanding the distinction helps you choose the right one for each situation.

A handicap bet gives you a binary outcome at a specified line. If the handicap is -7.5, the favoured side must win by 8 or more points. You are betting on one side of a line, and the odds are typically close to even money. A winning-margin bet gives you a range — say, 1-12 points — and the odds are longer because the range is narrower than the full spectrum of possible outcomes.
I use handicap bets when my conviction is about which side of a line the result will fall. If I believe a side will cover -7.5 but I am not confident about whether they will win by 8 or by 25, the handicap is the right market. I use winning-margin bets when my conviction extends to the nature of the victory — when I believe a match will be tight and the margin will stay within a specific band. That added specificity justifies the higher odds and the higher margin, because I am being paid for precision.
The breakeven point between the two markets is straightforward to calculate. If the handicap pays 1.90 at -7.5 and the winning-margin band of 1-12 pays 4.00 for the same side, the margin bet needs to land at a rate above 25% to be more profitable long-term, while the handicap needs to land above 52.6%. If my model says the probability of a 1-12 margin is 35%, the winning-margin bet offers better expected value. If it is 28%, the handicap is the better vehicle. This kind of direct comparison is the only honest way to decide between overlapping markets. For a parallel exercise in comparing market efficiency, over/under rugby betting applies the same logic to totals lines.
What are the typical margin bands offered by UK rugby bookmakers?
Most UK bookmakers offer winning-margin bands of 1-12, 13-18, 19-24, 25-30 and 31+ points for each side, plus a draw option. High-profile fixtures may feature tighter bands such as 1-6 and 7-12. The number of bands and the specific ranges can vary between operators, so checking the market structure before placing a bet is advisable.
Does winning margin include extra time?
Standard winning-margin bets are settled on the result at the end of normal time — 80 minutes in rugby. Extra time in knockout matches is typically excluded unless the bookmaker’s settlement rules explicitly state otherwise. If a match finishes level after 80 minutes, the draw band applies regardless of what happens in extra time. Always verify the specific terms with your operator.
Written by the editors at Rugby Betting Tips.