Rugby Handicap Betting: How to Read Lines and Find Edges
 Available in US

The Handicap Line Is Where Sharp Money Lives
Early in my career analysing rugby markets, I spent most of my time on match-winner bets. Who wins, who loses — simple. It took about two years of mediocre returns before a more experienced bettor told me something that reshaped how I approach every fixture: “The bookmaker does not care who wins. They care about the margin.” That single sentence redirected my entire focus toward handicap betting, and it is where the majority of my profitable rugby bets have come from ever since.
Handicap betting — also called spread betting or point-spread betting — strips away the binary win-or-lose question and replaces it with something far more nuanced: by how much? When you bet on a team at -7.5, you are not betting they will win. You are betting they will win by 8 or more points. When you take the other side at +7.5, you are betting that even if they lose, they will keep it within a single converted try. That margin question requires deeper analysis than simply picking a winner, and deeper analysis is exactly where preparation beats the market.
Sports betting is the largest segment of the UK online gambling market, accounting for 57.1% of revenue in 2025. Within that enormous pool, handicap markets attract a disproportionate share of informed money. Recreational bettors gravitate toward match-winner and accumulator markets because those are easier to understand. Sharper bettors — the ones who track scoring data, model expected margins and compare lines across operators — concentrate on handicaps because the pricing is more complex and therefore more likely to contain exploitable errors.
This guide breaks down every component of rugby handicap betting: how the mechanics work, why lines move, which scoring patterns to watch, how Union and League differ in their handicap characteristics, and the mistakes that cost bettors money. If you already know what a handicap is, skip the mechanics section and go straight to line movement — that is where the actionable edges start.
Mechanics of Handicap Betting in Rugby
Forget theory for a moment. Here is a real scenario. England are playing Italy in the Six Nations. The bookmaker sets the handicap line at England -14.5. If you back England -14.5 and they win 31-12, your bet wins — England’s winning margin is 19, which exceeds 14.5. If they win 24-14, your bet loses — the margin of 10 does not cover the spread. If you back Italy +14.5 in the same match and Italy lose 24-14, your bet wins — Italy’s defeat was only 10 points, which falls inside the 14.5-point cushion the handicap gave them.

The half-point in that line — the .5 — exists to eliminate the possibility of a push, where the handicap exactly matches the margin of victory and all bets are returned as a dead heat. Most UK bookmakers use half-point handicaps as standard for rugby, though you will occasionally see whole-number lines at operators who prefer the push mechanic. If the line is England -14 and England win by exactly 14, the bet is void and your stake is returned. Neither side wins, neither side loses. Whole-number lines reduce the bookmaker’s risk slightly, but they also reduce yours, which is why some bettors actively seek them out.
The odds attached to each side of the handicap are where the bookmaker builds their margin. In a perfectly efficient market, both sides would be priced at even money — 2.00 in decimal, evens in fractional. In practice, both sides are priced slightly below even money, typically around 1.90 to 1.95. That gap between the true 50/50 price and the offered price is the overround, and it represents the bookmaker’s theoretical profit margin. On a -14.5 / +14.5 line where both sides are priced at 1.91, the overround is approximately 4.7%. Your job as a handicap bettor is to find situations where the bookmaker’s line is wrong by more than that 4.7% margin — because only then does the bet have positive expected value.
One detail that trips up newer handicap bettors: the handicap is applied to the final score at full time. Extra time, if applicable, is typically excluded — though you should always check the operator’s specific settlement rules for cup competitions where extra time is possible. In standard league and championship rugby, the final whistle score is the only number that matters.
Handicap betting also comes in alternative lines. Instead of the standard -14.5, you might see options for -7.5, -10.5, -17.5 or -21.5, each at different odds. Taking a smaller handicap reduces your risk but pays worse odds. Taking a larger handicap increases the potential payout but requires a more dominant victory. The skill is in identifying which line offers the best ratio of probability to price — and that requires understanding scoring patterns, which I cover in a later section.
Asian Handicap vs European Handicap: Which Suits Rugby
If you have bet on football, you have probably encountered Asian handicaps. The question is whether the same format works for rugby, and the answer is: partially, with caveats.
A European handicap is the standard format described above — a fixed spread, fixed odds, settled at full time. An Asian handicap splits your stake across two lines. For example, an Asian handicap of -12.0/-14.0 (sometimes written as -13.0 on a quarter-line) means half your stake goes on -12 and half on -14. If the margin of victory is exactly 13, you win the -12 portion and lose the -14 portion, returning roughly half your stake. It is essentially a built-in partial hedge.
Asian handicaps are less common in rugby than in football at UK bookmakers. The reason is structural: rugby’s scoring increments — 3 for a penalty, 5 for a try, 2 for a conversion, giving 7 for a converted try — create a lumpier scoring distribution than football’s single-goal increments. In football, the difference between winning by 1 and winning by 2 is one goal. In rugby, the difference between winning by 7 and winning by 14 is one converted try — but the difference between winning by 7 and winning by 10 is a penalty, which lands with different probability than a try. That lumpiness makes half-point European handicaps more intuitive for rugby pricing.
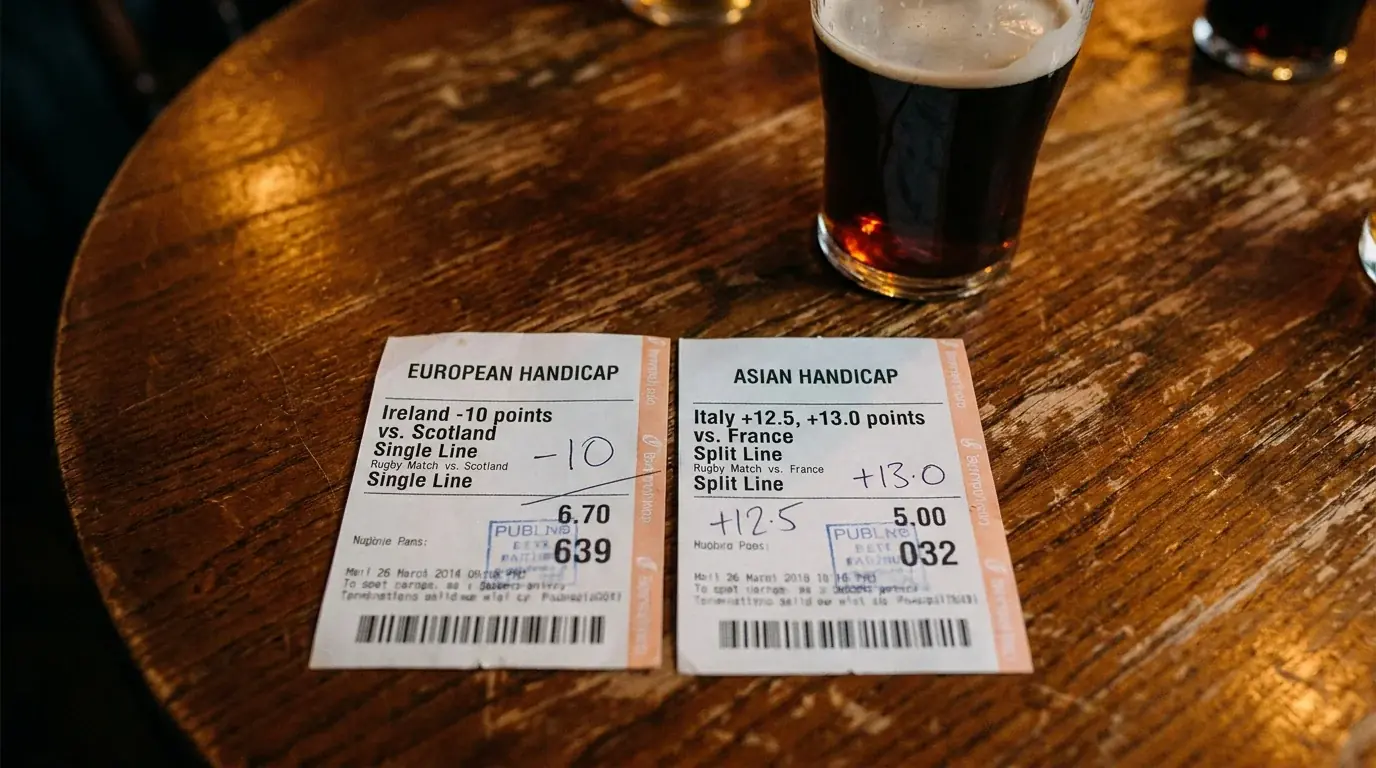
That said, Asian handicaps are worth seeking out when the standard European line sits on an awkward number. If the line is -14.5 and you think England will win by roughly 14-17 points, an Asian -12.0/-14.0 gives you protection on the downside that a straight -14.5 does not. I use Asian handicaps selectively — maybe two or three times per Six Nations — but they are a useful tool when the standard line feels half a score too tight.
Why Lines Move and What It Tells You
I check the opening handicap line for every major rugby fixture, note it in a spreadsheet, and then check again the morning of the match. The difference between those two numbers is one of the most underused signals in rugby betting.
Handicap lines move for three reasons, and distinguishing between them is critical. The first is sharp money. When large, well-informed bettors place significant stakes on one side of the handicap, the bookmaker adjusts the line to balance their liability. If the opening line is -10.5 and it moves to -12.5 within 48 hours, that movement almost certainly reflects sharp action on the favourite. The bookmaker is not guessing — they are reacting to money from accounts with a proven track record. If you see a line move two or more points in the first 24 hours after opening, pay attention. The sharp side is telling you something your own analysis may have missed.

The second reason is news. Team announcements, injury updates, weather forecasts, referee appointments — any new information that changes the expected margin of victory will move the line. The key player here is timing. Team lineups for Six Nations matches are announced two days before kick-off. In the Premiership, they come out on a Friday for Saturday fixtures. The line moves sharply in the hours after team news, and if you have done your homework on squad composition and likely selection, you can anticipate which direction the line will jump and position yourself before the announcement. With 290.03 million online bets placed monthly on real events in the UK, that window of post-announcement adjustment is narrow — but it exists.
The third reason is public money. As the match approaches, recreational bettors pile in, and they tend to back favourites and popular teams. This weight of public money can push the line further toward the favourite than the underlying probabilities justify. When England play at home, the line almost always drifts toward England as kick-off approaches, regardless of whether the opening line was fair. That drift creates value on the underdog side. I call this the “England tax” in my notes, and it applies to any high-profile team with a large casual following — France at home is another example.
Tracking line movement does not require sophisticated tools. Open an account at three or four operators, note the opening handicap for the fixtures you are interested in, and compare them to the closing line on match day. Over a season, patterns emerge: which operators move first, which ones are slowest to adjust, and which matchups consistently see late-public drift. That data becomes your edge in handicap markets.
Scoring Patterns That Handicap Bettors Must Track
Here is something that changed my handicap betting completely: rugby margins of victory are not evenly distributed. They cluster around certain numbers, and those clusters are driven by the scoring system itself.
A converted try is worth 7 points. A penalty goal is worth 3. An unconverted try is 5. These increments mean that winning margins of 7, 10, 14, 12 and 5 are far more common than margins of 1, 2, 4, 6 or 8. When a bookmaker sets the line at -9.5, they are placing it in a gap between the 7-point cluster (one converted try margin) and the 10-point cluster (converted try plus penalty). Your job is to assess whether the game is more likely to produce a one-score or two-score margin, and whether the line sits on the right side of that boundary.
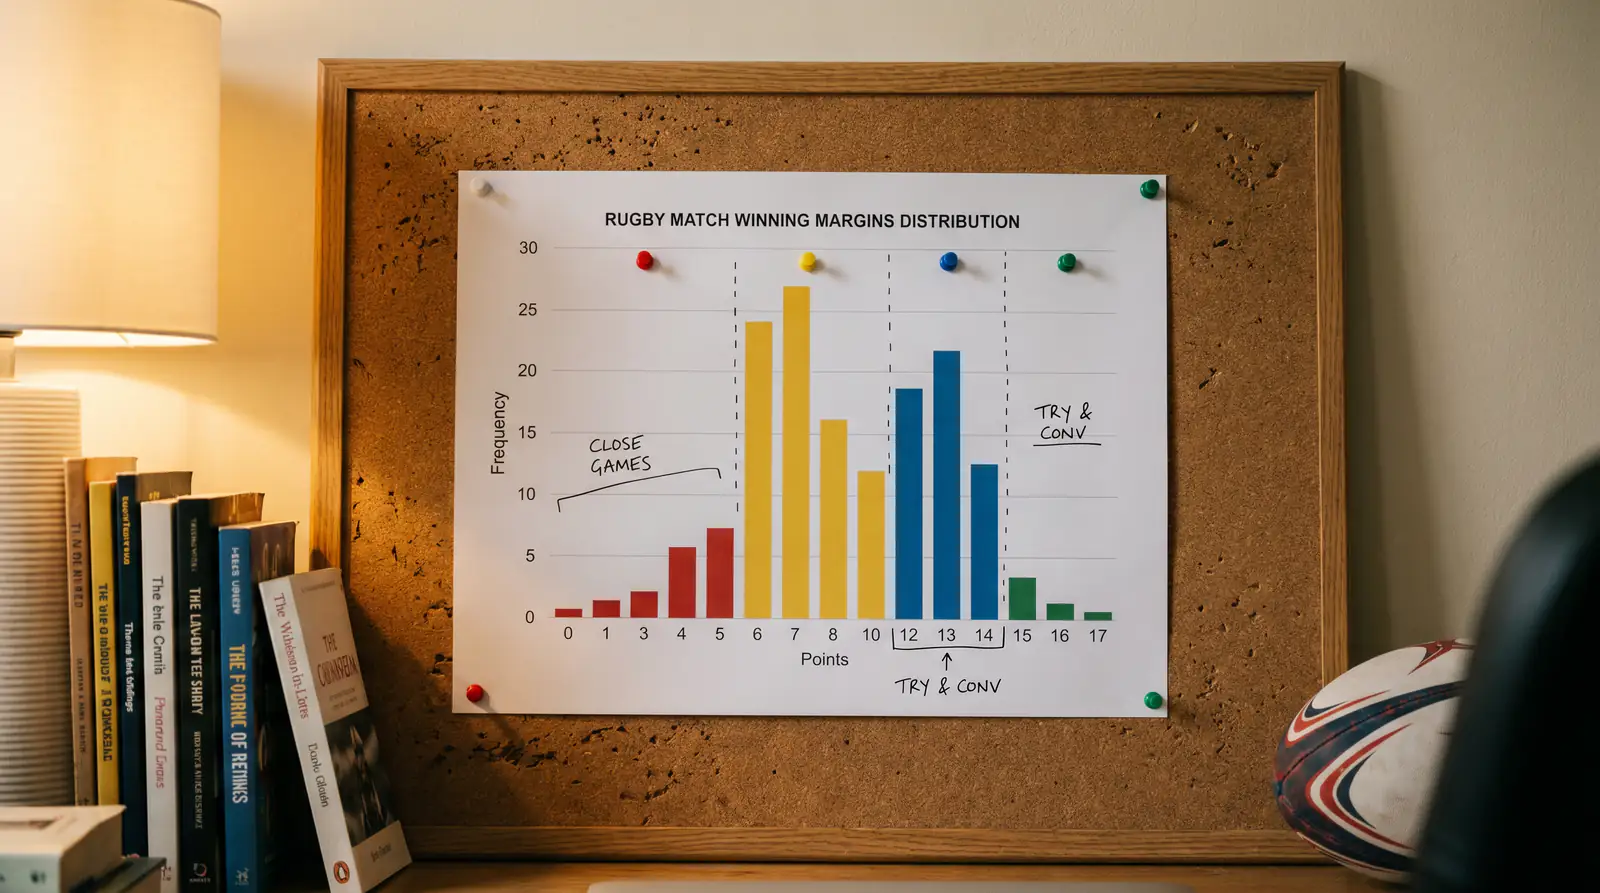
The 2025 Six Nations averaged 55 points per match, but that average masks enormous variation between fixtures. Matches between the top three sides — France, Ireland, England — tended to be tighter, with margins under 10 points. Matches involving the bottom two regularly produced margins of 15 or more. This is not surprising, but it has a direct implication: the handicap line on a top-versus-bottom fixture needs to be assessed differently from a line on a top-versus-top clash. In the former, I am looking at whether the line accurately reflects the talent gap. In the latter, I am asking whether the margin is more likely to be decided by a single penalty or conversion — the kind of fine detail that models often get wrong.
Another pattern worth tracking is second-half scoring differentials. In international rugby, the stronger team tends to pull away in the final quarter. Fatigue, bench depth and tactical adjustments all favour the side with more resources. If you are considering a handicap that feels borderline — say, backing a favourite at -10.5 when you think the margin will be around 10 — ask yourself whether the favourite has the bench to close out the final 20 minutes. If they do, the margin is more likely to land on 14 than 7, and the -10.5 becomes viable. If their bench is weaker than their starting XV, a tighter margin is more probable, and you might be better off taking the underdog or seeking a winning margin market where you can target a specific band.
Red zones — the frequency with which a team enters the opposition 22 and converts that entry into points — are the best leading indicator I have found for handicap outcomes. A team with a high red-zone conversion rate will win by larger margins than their overall possession and territory stats suggest, because they are efficient at turning pressure into scoreboard impact. Conversely, a team that dominates territory but is wasteful inside the 22 will produce tighter margins. Track red-zone efficiency across three or four matches and you have a better handicap predictor than the bookmaker’s opening line provides.
Handicap Differences Between Union and League
I bet on both codes, and the single biggest adjustment I make when switching between Rugby Union and Rugby League handicaps is recalibrating my sense of what “a close game” looks like.
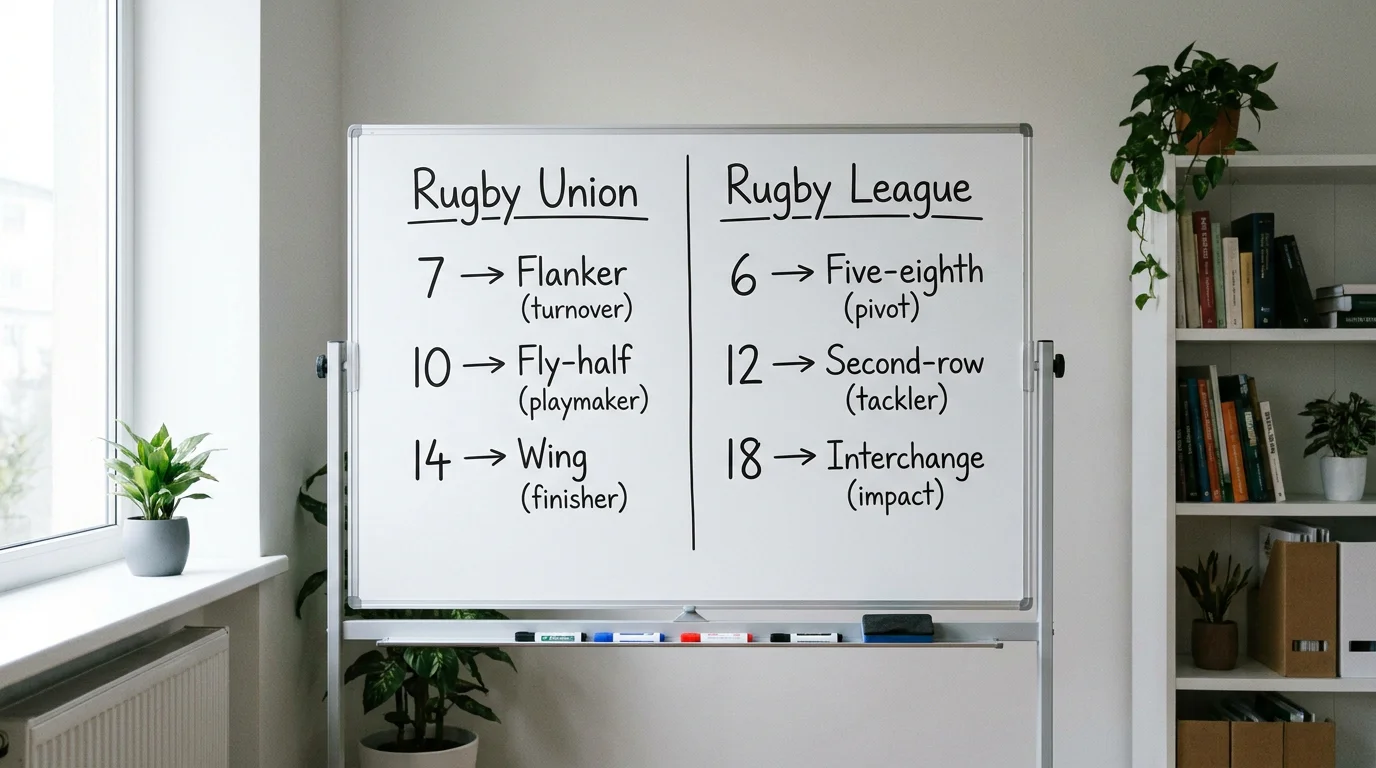
In Union, a 7-point margin feels decisive. One converted try separating the sides at full time usually means one team was meaningfully better than the other. In League, a 6-point margin — one converted try in that code — can result from a single set of six in the final minutes. The higher pace, faster ball recycling and more frequent scoring in League mean that margins are inherently more volatile. A team trailing by 12 at half time in League can realistically close that gap in two sets. In Union, a 12-point deficit at the break is a significant obstacle because the game’s structure — contested scrums, lineouts, slower ball — makes it harder to score quickly.
This volatility difference changes how I approach handicap lines in each code. In Union, I am comfortable backing a line of -14.5 if my analysis suggests the favourite is genuinely two scores better, because the trailing team’s ability to mount a late comeback is limited by the pace of the game. In League, I am far more cautious with equivalent lines. A -12.5 in League is a bigger ask than it looks, because the losing side always has the structural opportunity to score quickly from restart possessions and sustained sets.
The scoring increments differ too. Union’s 3-5-7 structure produces different margin clusters from League’s 4-6 structure (try worth 4, conversion worth 2). This means that popular handicap lines in Union — particularly -7.5 and -14.5 — sit at psychologically significant boundaries that correspond to converted-try multiples, while the equivalent “key numbers” in League are -6.5 and -12.5. Knowing these key numbers for each code and understanding when the bookmaker’s line sits on the right or wrong side of them is the foundation of code-specific handicap strategy.
The global rugby market is valued at $6.9 billion and projected to reach $11.9 billion by 2033, with League’s shorter format attracting growing broadcast and betting interest alongside Union’s established calendar. As both codes expand their betting footprint, the handicap markets in League are deepening, offering more alternative lines and tighter pricing than they did even three years ago. The opportunity set for handicap bettors in both codes is larger now than it has ever been.
Five Handicap Mistakes and How to Avoid Them
I have made every one of these mistakes myself, most of them more than once. Handicap betting rewards discipline, and discipline means learning what not to do just as thoroughly as learning what to do.
The first mistake is ignoring the weather. Rain, wind and cold compress scoring in rugby, particularly in Union. A handicap line set in dry conditions might be perfectly fair, but if a storm front moves in on match day, the total points drop and the margin of victory usually compresses with it. I check the weather forecast for the specific ground — not the city, the ground — within two hours of kick-off before confirming any handicap bet. A line of -14.5 in sunshine is a different proposition from -14.5 in driving rain.
The second mistake is treating the handicap line as a prediction. It is not. The line is the number at which the bookmaker believes they will attract equal money on both sides. That is a commercial calculation, not an analytical one. The bookmaker does not care whether England win by 15 or Italy win outright — they care about balancing their book. When the public overwhelmingly backs the favourite, the line moves toward the favourite to attract money to the other side. The closing line reflects market sentiment, not ground truth. Your edge comes from knowing when sentiment has pushed the line away from the probable outcome.
The third mistake is not tracking closing lines. Every handicap bettor should record the line at which they placed their bet and compare it to the closing line — the final number at kick-off. If you consistently beat the closing line (your bet was placed at a better number than where the market settled), you are finding value. If you consistently take worse numbers than the close, you are being picked off by late-moving information. Closing-line value is the single most reliable indicator of long-term profitability in handicap betting.
The fourth mistake is overreacting to a single result. Andreas Krannich of Sportradar, commenting on the challenge of maintaining sporting integrity across global competitions, noted that sustained vigilance matters more than reactive responses — and the same principle applies to handicap analysis. One blowout result does not redefine a team’s quality. If Scotland lose by 30 in Round 2 and the market adjusts their Round 3 handicap by 10 points, ask whether that 30-point defeat reflected a genuine performance collapse or a contextual anomaly — a red card at 20 minutes, a key injury, a referee interpretation that disrupted their set-piece. More often than not, the anomaly explains the margin, and the market overcorrection creates value on the team that just lost badly.
The fifth mistake is betting every fixture. Handicap markets reward selectivity. Not every match has a mispriced line. Not every line movement is meaningful. I typically place handicap bets on three or four fixtures per Six Nations round, leaving one or two alone entirely because the line looks fair and there is no edge worth pursuing. The temptation to have action on every match is the enemy of disciplined handicap betting. If the line looks right, the best bet is no bet at all.

Frequently Asked Questions
What does a -7.5 handicap mean in a rugby match?
A -7.5 handicap means the favoured team must win by 8 or more points for a bet on them to succeed. The 7.5-point spread is subtracted from their final score for settlement purposes. If they win 24-14, the adjusted margin is 10, which beats -7.5. If they win 20-14, the adjusted margin is 6, which does not. The opposing side at +7.5 wins if they win the match outright or lose by fewer than 8 points.
How do weather conditions specifically affect handicap outcomes?
Rain and wind compress scoring by increasing handling errors, reducing kicking accuracy and slowing the pace of play. In wet or windy conditions, total points tend to drop and margins of victory narrow. A handicap line of -14.5 set in dry conditions becomes significantly harder to cover if heavy rain arrives on match day. Checking the ground-specific weather forecast within hours of kick-off and comparing it to the conditions assumed when the line was set is one of the most practical edges available to handicap bettors.
Is Asian handicap available for rugby at most UK bookmakers?
Asian handicap options for rugby are less widely available than for football. The larger operators do offer them on major fixtures — Six Nations, Premiership, Super League — but the range of lines is usually narrower than in football markets. Asian handicaps are most useful in rugby when the standard European line sits on an awkward number close to a key scoring increment, as splitting the stake across two lines provides a partial hedge that a single European line cannot offer.
Published by the Rugby Betting Tips team.